![]()
![]()
![]()
Use LEFT and RIGHT arrow keys to navigate between flashcards;
Use UP and DOWN arrow keys to flip the card;
H to show hint;
A reads text to speech;
55 Cards in this Set
- Front
- Back
|
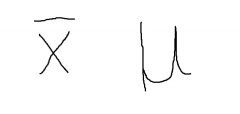
What are the symbols for population and sample mean?
|

|
|
|
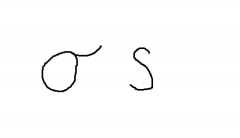
What are the symbols for population and sample variance?
|

|
|
|
What are the symbols for population and sample standard deviation?
|

|
|
|
Define variance
|
How far the population is spread about the mean
|
|
|
Define standard deviation
|
The square root of the variance.
|
|
|
Define Parameter
|
Descriptive Measure about a population
|
|
|
Define statistic
|
Descriptive Measure about a sample
|
|
|
What are the 3 types of data
|
Interval
Ordinal Nominal |
|
|
What is the most appropriate measure of central location for interval data?
|
mean, median, and/or mode are all appropriate
|
|
|
What is the most appropriate measure of central location for ordinal data?
|
Median
|
|
|
What is the most appropriate measure of central location for nominal data?
|
Mode
|
|
|
According to the empirical rule, what percentage of all observations fall within:
1 standard deviation 2 standard deviations 3 standard deviations |
1. 68%
2. 95% 3. 99.7% |
|
|
Describe Chebysheff's theorum
|
The proportion of observations in any sample or population that lie within K standard deviations of the mean is at least:
1-(1/K^2) for K>1 |
|
|
What is type of distribution is the empirical rule used for?
What distribution is chebysheff's rule used for? |
Empirical: normal
Chebysheff: skewed |
|
|
How can variability be compared with multiple sets of interval data?
|
By using the coefficient of variation?
|
|
|
What is the formula for the coefficient of variation?
|
CV = standard deviation/mean
|
|
|
What does the interquartile range equal? What does this measure?
|
Q3-Q1
Measures the spread of the middle 50% of the observations. |
|
|
What do large values of the interquartile range indicate?
|
That first and third quartile are far apart and that there is high variability in the data.
|
|
|
In a box plot, if the line is left of center, then the data is skewed______?
|
Skewed to the right (or positively)
|
|
|
In a box plot, if the line is right of center, then the data is skewed ______?
|
Skewed to left (or negatively)
|
|
|
In a box plot, what do points outside the whiskers represent?
|
Outliers
|
|
|
How are outliers identifified using the interquartile range?
|
Outliers will exist
Above: Q1+1.5(IQR) Below: Q1-1.5(IQR) |
|
|
What is the R^2 value?
|
R^2 is the coefficient of determination. It is the proportion in the dependent variable explained by the independent variable.
|
|
|
an R^2 value of .75 means...?
|
.75 of Y (dependent) is caused by X (independent). .25 of Y is unexplained.
|
|
|
What are the methods of data collection?
|
direct observation
experiments surveys personal inteview telephone interview |
|
|
What are the types of sampling plans?
|
convenience sampling
Stratified Proportional stratified Cluster Systematic |
|
|
Define cluster sampling
|
First dividing population into clusters, then take random sample of clusters, then take random sample of elements in each cluster.
|
|
|
Define systematic sampling
|
Random every nth item selected.
|
|
|
What are the types of errors in sampling. Define them.
|
Sampling errors: when sample mean is different from population mean (margin of error)
Non-sampling error: error not caused by sampling |
|
|
What are the types of non sampling errors?
|
Random errors - unpredictable. The larger the population the more random error cancels out.
Systematic error - error in question design, non-responsive, biased answers. |
|
|
What are the measures of reliability?
|
Confidence and Significance Level
|
|
|
Define confidence level
|
The proportion of times an estimation procedure will be correct
|
|
|
Define significance level
|
How frequently a conclusion will be incorrect in the long run.
|
|
|
A confidence level of 95% means that the significance level is______%
|
CL or 95% = SL of 5%
|
|
|
What are the 3 approaches to probability?
|
Classical/Theoretical
Subjective Approach Relative Frequency Approach |
|
|
Describe the classical approach to probability
|
Can only use when events are equally likely
|
|
|
Describe the relative frequency approach to probability
|
Collect data, conduct an experiment, obtain and organize results.
P(a)=frequency/sample size Approximate probabilities |
|
|
How do you find the number of marginal probabilities that exist in a table?
|
Add the rows and columns to find the number of marginal probabilities
|
|
|
What is the notation for the probability of event A given event B?
|
P(A|B)
|
|
|
How is it determined If event A and event B are independent?
|
if P(A|B) = A, then A and B are independent.
|
|
|
P(A|B) =
|
P(A|B) = P(A and B)/P(B)
|
|
|
If A and B are independent, the P(A and B) =
|
P(A and B) = P(A) * P(B)
|
|
|
If A and B are not independent, then P(A and B) =
|
P(A and B) = P(A)*P(B|A)
|
|
|
P(A or B) =
What kind of probability does this describe? |
P(A or B) = P(A) + P(B) - P(A and B)
Compound probability |
|
|
If events A and B are mutually exclusive, then P(A or B) =
|
P(A or B) = P(A) + P(B)
|
|
|
Class width =
|
(largest observation - smallest observation)/number of rows desired
|
|
|
Relative frequency =
|
Relative frequency = frequency occurred in row divided by total sample frequencies.
|
|
|
Cumulative relative frequency =
|
Cumulative relative frequency = Relative frequency accumulated
|
|
|
Cumulative frequency =
|
Cumulative frequency = frequency accumulating
|
|
|
What is an ogive?
|
A cumulative frequency graph. Always goes upward, never downward. Uses relative frequency. It shows what percentage of the sample is below a certain number.
|
|
|
What is a stem and leaf plot?
|
A graphical depiction of observation in a sample. The first digit = Stem, Second digit = leaf.
|
|
|
When is a histogram symmetric?
|
When mean=median=mode
|
|
|
When are histograms skewed to the right? left?
|
skewed right = mean is to the right of median
skewed left = mean is to the left of median |
|
|
What are the 3 measures of variation?
|
Range
Variance Standard Deviation |
|
|
Class Width =
|
(Largest observation - Smallest Oberservation)/class width
|

