![]()
![]()
![]()
Use LEFT and RIGHT arrow keys to navigate between flashcards;
Use UP and DOWN arrow keys to flip the card;
H to show hint;
A reads text to speech;
9 Cards in this Set
- Front
- Back
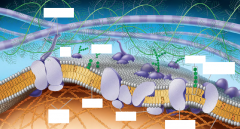
Figure 7.5 |
Because models are hypotheses, replacing one model ofmembrane structure with another does not imply that theoriginal model was worthless. The acceptance or rejection of amodel depends on how well it fits observations and explainsexperimental results. New findings may make a model obsolete;even then, it may not be totally scrapped, but revised toincorporate the new observations. The fluid mosaic model iscontinually being refined. For example, groups of proteins areoften found associated in long-lasting, specialized patches,where they carry out common functions. The lipids themselvesappear to form defined regions as well. Also, the membranemay be much more packed with proteins thanimagined in the classic fluid mosaic model—compare the updatedmodel in Figure 7.5 with the original model in Figure7.3. Let’s now take a closer look at membrane structure. |
|
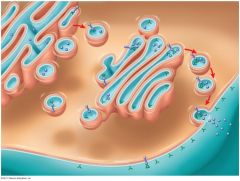
Figure 7.12 |
Figure 7.12 shows how membrane sidednessarises: The asymmetrical arrangement of proteins, lipids, andtheir associated carbohydrates in the plasma membrane is determinedas the membrane is being built by the endoplasmicreticulum (ER) and Golgi apparatus. The cytoplasmic (orange) face of theplasma membrane differs from the extracellular (aqua) face. The latterarises from the inside face of ER, Golgi, and vesicle membranes. |
|
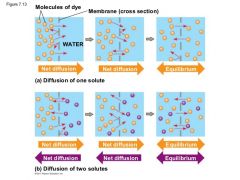
Figure 7.13 |
a) Diffusion of one solute. The membrane has pores large enoughfor molecules of dye to pass through. Random movement of dyemolecules will cause some to pass through the pores; this will happenmore often on the side with more dye molecules. The dyediffuses from where it is more concentrated to where it is less concentrated(called diffusing down a concentration gradient). Thisleads to a dynamic equilibrium: The solute molecules continue tocross the membrane, but at equal rates in both directions. b)Diffusion of two solutes. Solutions of two different dyes are separatedby a membrane that is permeable to both. Each dye diffusesdown its own concentration gradient. There will be a net diffusionof the purple dye toward the left, even though the total soluteconcentration was initially greater on the left side. |
|
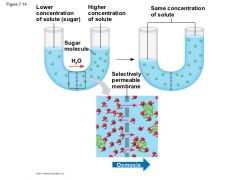
Figure 7.14 |
Two sugar solutions of differentconcentrations are separated by a membrane that the solvent (water)can pass through but the solute (sugar) cannot. Water molecules moverandomly and may cross in either direction, but overall, water diffusesfrom the solution with less concentrated solute to that with moreconcentrated solute. This diffusion of water, or osmosis, equalizes thesugar concentrations on both sides. |
|
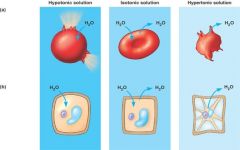
Figure 7.15 |
a)Animal cell. Ananimal cell fares bestin an isotonic environmentunless it hasspecial adaptationsthat offset the osmoticuptake or loss ofwater. (b) Plant cell. Plant cellsare turgid (firm) andgenerally healthiest ina hypotonic environment,where theuptake of water iseventually balancedby the wall pushingback on the cell. |
|
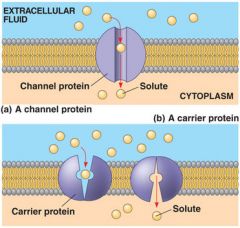
Figure 7.17 |
Two types of transport proteins that carryout facilitated diffusion. In both cases, the protein can transportthe solute in either direction, but the net movement is down theconcentration gradient of the solute. a)A channelprotein (purple)has a channelthrough whichwater moleculesor a specificsolute can pass. b)A carrier protein alternates between two shapes, moving a soluteacross the membrane during the shape change. |
|
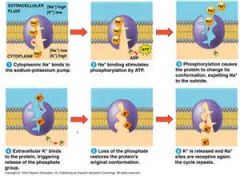
Figure 7.18 |
The sodium-potassium pump: a specific caseof active transport. This transport system pumps ions against steepconcentration gradients: Sodium ion concentration ([Na]) is highoutside the cell and low inside, while potassium ion concentration ([K])is low outside the cell and high inside. The pump oscillates between twoshapes in a cycle that moves 3 Na out of the cell for every 2 Kpumped into the cell. The two shapes have different affinities for Naand K. ATP powers the shape change by transferring a phosphategroup to the transport protein (phosphorylating the protein). |
|
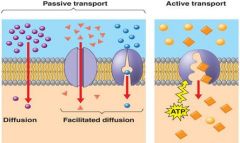
Figure 7.19 |
Passive transport. Substances diffusespontaneously down their concentrationgradients, crossing a membrane with noexpenditure of energy by the cell. The rateof diffusion can be greatly increasedby transport proteins in the membrane. Active transport.Some transport proteinsact as pumps, movingsubstances across amembrane against theirconcentration (or electrochemical)gradients.Energy for this work isusually supplied by ATP. |
|
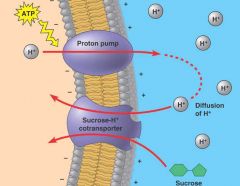
Figure 7.21 |
Cotransport: active transport driven by aconcentration gradient. A carrier protein, such as this sucrose-Hcotransporter in a plant cell, is able to use the diffusion of H down itselectrochemical gradient into the cell to drive the uptake of sucrose.The H gradient is maintained by an ATP-driven proton pump thatconcentrates H outside the cell, thus storing potential energy that canbe used for active transport, in this case of sucrose. Thus, ATP indirectlyprovides the energy necessary for cotransport. (The cell wall is not shown.) |