Reading...
![]()
Play button
![]()
Play button
![]()
Use LEFT and RIGHT arrow keys to navigate between flashcards;
Use UP and DOWN arrow keys to flip the card;
H to show hint;
A reads text to speech;
162 Cards in this Set
- Front
- Back
|
GIS
|
Geographic: spatial component
Information: tabular data or relational database System: integration of computer power/ dynamic hosting for information OR Science: methodology for answering a spatial query GIST: Geographic Information Science and Technology |
|
|
One Definition of GIS
|
a collection of practices, software and hardware with the ability to collect, store, display and analyze spatial/geographical content
|
|
|
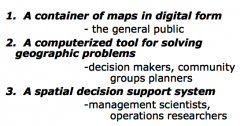
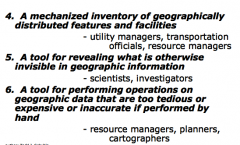
Views of GIS
|
|
|
|
Views of GIS contd
|
|
|
|
What "makes GIS so special" ?
|
analytical power in layering information; insight in spatial display of quantitative information
|
|
|
Goals of GIS
|
to utilize spatial component of data to maximum extent/maximum insight; relatable/interchangeable/combinable data
|
|
|
Analytical GIS
|
used for robust spatial analysis, cartography, spatial modeling, spatial statistics
|
|
|
Simple GIS applications
|
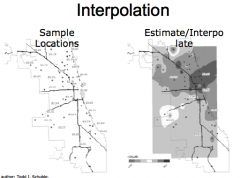
demographic change, policy analysis, regression maps, distance/proximity analysis, exploring accessibility (public transit setups), interpolation (where to buy cheap gas?), density/heat maps, raster analysis (combining population data with risk; questions like "how many people would die in a tsunami .. here?", temporal analysis w/ animation
|
|
|
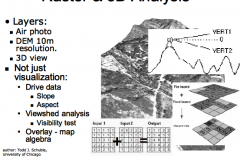
Raster and 3D analysis
|
|
|
|
Technical GIS
|
software packages, scripting, data management and compatibility,
|
|
|
Levels of Representation in GIS
|
1. reality, 2. conceptual model, 3. logical model, 4. physical model
traditional maps are mute and still! "can't be queried" |
|
|
GIS' obvious 'problem'
|
some abstraction still required b/c of practical hardware and data limitations (how fine to render the shoreline?)
|
|
|
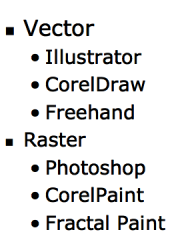
Two discrete Conceptual models to pursue in GIS rendering and data treatment
|
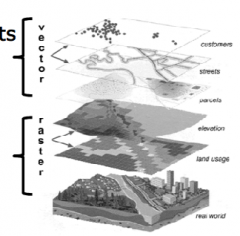
discrete objects (only by data provided) (VECTOR) vs continuous fields (must account for areas where data doesn't exist) (RASTER)
|
|
|
Geographic data components
|
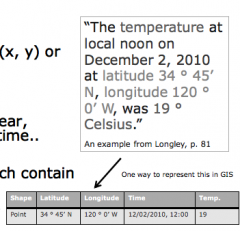
space, time, attributes (categorical/qualitative?)
|
|
|
Data attributes in GIS
|
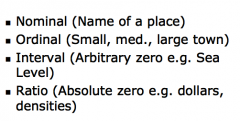
identification, associated data, spatial relationships; classified by scale of measurement (nominal, ordinal, ratio, interval, cyclic)
|
|
|
Some GIS history
|
hearkened by computer growth, cold war, but John Snow's 1854 cholera map is classic 'GIS concept' work i.e. 'statistical map'
others: Charles Booth poverty map, DuBois' 'Philadelpha Negro', Hull-house maps Harvard's ODYSSEY (1970) is computational turning point with topological 'arc-node' (vector) data structure |
|
|
cartography
|
science of construction, use and principles of maps
important because data needs to be on the same projection! |
|
|
Definition of 'map'
|
representation of geographic phenomenon as a set of symbols "and at a scale whose representative fraction is less than one to one"
|
|
|
Coordinate system
|
location reference system for spatial features on Earth's surface
also known as geocode, needs to be unique assignment X-direction = ' EASTING' Y-direction = 'NORTHING' |
|
|
Earth models/ 'datums'
|
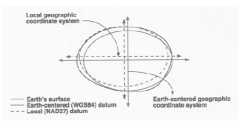
models to capture Earth's dimensions
Datum: adjusted ellipsoid; can be locally adjusted by changing the location of the spheroid to the geoid to preserve accurate measurements of a particular area |
|
|
Projections
|
Mathematically represent the surface of the earth for different purposes in different mediums
|
|
|
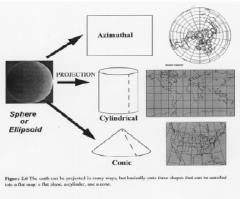
Three models of earth projection
|
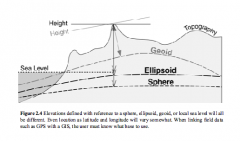
sphere, ellipsoid, geoid (geoid most accurate because lumpy)
The earth's ellipsoid is only 1/297 off from a sphere! |
|
|
Commonly used ellipsoids
|
Clarke 1866, GRS80, WGS84
|
|
|
To compare or edge-match maps in a GIS...
|
both maps must be in the same coordinate system
|
|
|
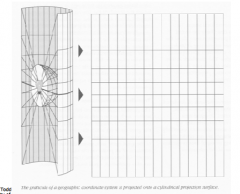
graticule
|
a grid of parallels and meridians shown as lines on a map
|
|
|
Commonly used coordinate systems in the U.S.
|
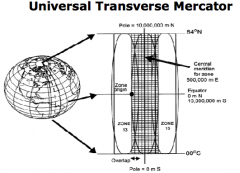
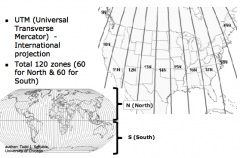
Geographic coordinate system (lat-long)
OR grid-based coordinate systems: UTM (universal transverse mercator, is projection system AND coordinate system) State Plane coordinate system PLSS (public land survey system) |
|
|
Universal Transverse Mercator
|
|
|
|
UTM Zones
|
|
|
|
State plane coordinate system
|
plane rectangular coordinates for each of 50 states; scale accuracy up to 4x of UTM, in feet, each state has false origin for various zones
|
|
|
public land survey system
|
not used for eastern original colonies and Texas, six-mile squares (farm flyovers); all land titles W of ohio river use PLSS for parcel descriptions
|
|
|
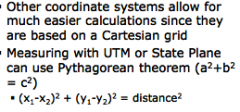
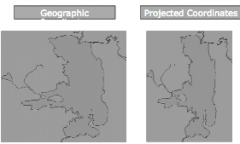
Measuring with coordinates
|
|
|
|
Measuring with coordinates: Geographic vs projected
|
|
|
|
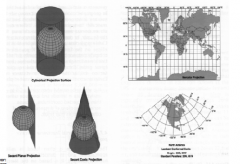
Map projections
|
|
|
|
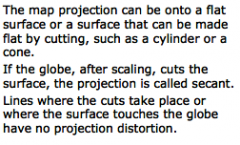
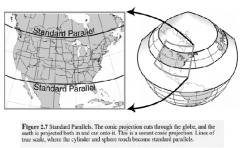
secant projection
|
|
|
|
Map projections contd
|
|
|
|
Map projections contd
|
|
|
|
Cylindrical projections
|
|
|
|
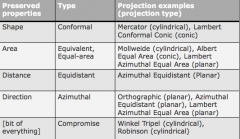
conformal
|
shape-preserving; no flat map can be both equivalent and conformal
|
|
|
equal area
|
preserves area
|
|
|
equidistant
|
preserves distance ;)
|
|
|
Plate carree
|
default ARCGIS 10.1, evenly placed graticules
|
|
|
Mercator
|
used for navigation because straight line on map represents constant bearing and direction
lines called 'rhumb line' or 'loxodrome' lines are NOT the shortest distance to travel |
|
|
lambert conformal conic
|
preserves shape; often used for regional maps; used for most state-plane coordinate zones which spread east-west
|
|
|
Standard parallels
|
|
|
|
Albers equal area conic
|
relative area- preserving conic; like lambert conformal, not suitable for global projections
|
|
|
Azimuthal equal area
|
preserves area BUT center of the map is only point with no distortion
|
|
|
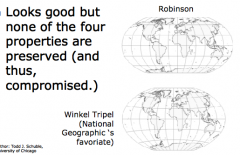
Compromise projections
|
|
|
|
Review of projection classes and associated distortions
|
|
|
|
NO FLAT MAP...
|
can be equivalent AND conformal
|
|
|
Units on GIS?
|
None! Scaleless
|
|
|
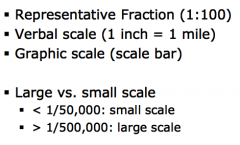
types of map scale
|
|
|
|
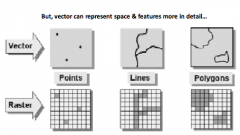
two main GIS data models
|
raster and vector ; need to make choice because analysis, representation and spatial data relationships can be limited
|
|
|
Raster data
|
grid of cells; cell contains representative values
cell has resolution (in ground units), stores info about location and characteristics; every cell has a value even if 'missing' points and lines have to move to a cell center, each cell can be owned by only one feature, all cells have to be able to hold the max value WELL SUITED FOR values CONTINUOUSLY CHANGING over AREAS (elevation, temperature, precipitation, population density) can also represent discrete values (landcover, vegetation type) non-displayed (not graphically displayed) information about each raster cell in VAT (value attribution table) data not necessarily georeferenced (most software accepts straight .gif etc images) |
|
|
vector data
|
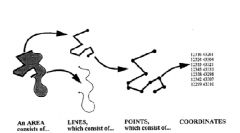
vector data represents features using three types of geometry: points, lines, polygons (areas)
points are given in order, lines are ordered; i.e. vectors can store relationship information (topology) |
|
|
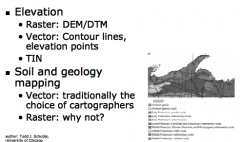
DEM
|
Digital Elevation Model aka Digital Terrain Model
|
|
|
Raster Advantages
|
simple data structure, easy to edit, easy to render, good at representing surfaces / continuous data, good for satellite and aerial photography, easy to incorporate math because all spatial entities have a relatively simple shape
|
|
|
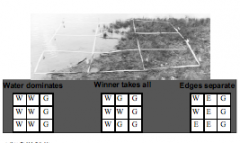
mixed pixel problem
|
|
|
|
Vector polygons...
|
must have the same starting and ending vertex, can have areas of exclusion (hollow centers), may include multiple parts (Hawai'i)
|
|
|
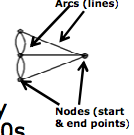
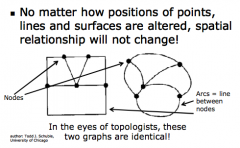
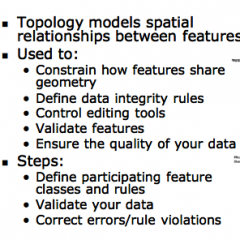
What is topology?
|
a mathematical procedure for explicitly defining spatial relationships; enables GIS software 'adjacency, connectivity, proximity, coincidence'
|
|
|
Major topological concepts
|
connectivity: arcs connect to each other at nodes
defn area: arcs that inscribe an area define a polygon contiguity/adjacency: arcs have direction and Left/Right sides |
|
|
In topology, position vs 'spatial relationship'
|
|
|
|
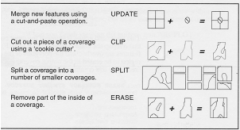
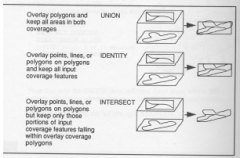
Advantages of topology in GIS
|
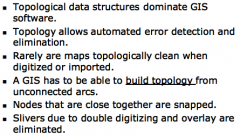
Complete topology makes map overlay feasible! Allows many GIS operations to be done w/o accessing point files.
|
|
|
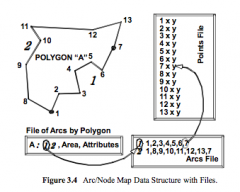
Arc/node map data structure w/files
|
|
|
|
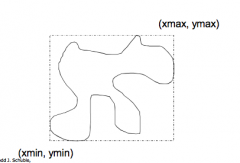
Bounding rectangle
|
|
|
|
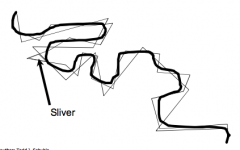
Slivers
|
|
|
|
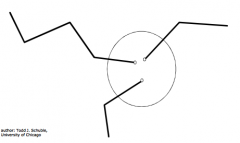
Unsnapped node
|
|
|
|
Vector advantages
|
v. accurate point, line and area features, compact data structure (way smaller files than raster), works well w/ manual data creation methods, topology can be represented (--> network analysis)
|
|
|
Vector DISadvantages
|
more complex data structure than raster so BECOMING SIMPLIFIED --> object-oriented model
more difficult to render than raster (HQ and complicated drawing) |
|
|
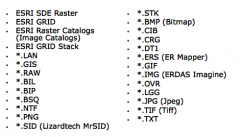
Supported Raster Formats
|
|
|
|
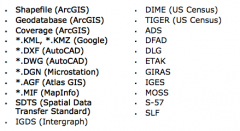
Supported Vector Formats
|
|
|
|
Data conversion
|
vector --> raster is easy,
raster (back) to vector is hard |
|
|
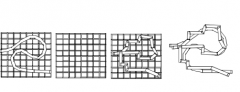
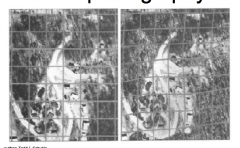
Discernable difference in representation between raster and vector data
|
|
|
|
Graphical example of vector/raster conversion error
|
|
|
|
3D/Voluminous data structures
|
can be in either raster or vector format
DEM (digital elevation model) is by far the most used raster structure for volume, and TIN (triangulated irregular network) most popular for vectors |
|
|
TIN
|
triangulated irregular network, way to handle 3D vector field data; more efficient than a grid, uses an optimal triangulation of a set of irregularly distributed points
no attribute table but can calculate elevation, slope and aspect on the fly good for hydrological analysis |
|
|
Which data structure to choose?
|
|
|
|
Behind the Map ~~
|
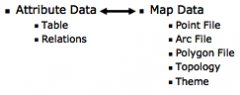
attribute data files or relational database management systems (RDMS) are back-end, simple to complex depending on data
tables can be linked through common 'keys' (common data fields) |
|
|
Database Managment System
|
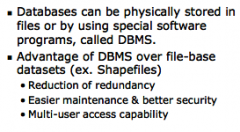
DBMS
|
|
|
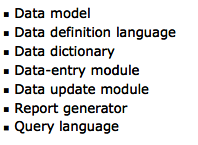
DBMS contains/provides...
|
|
|
|
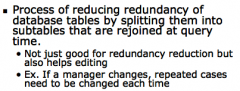
Normalization
|
|
|
|
Object- and Object-relational DBMS
|

|
|
|
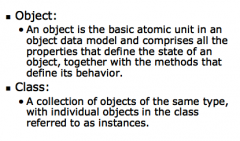
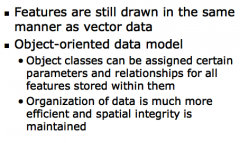
Object-oriented data model
|
|
|
|
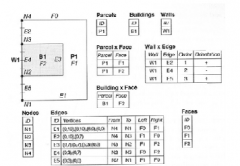
Example: Normalized database topology model
|
|
|
|
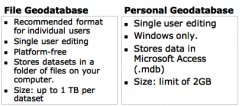
Geodatabase Types
|
|
|
|
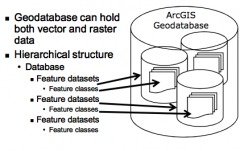
Simple geodatabase example
|
|
|
|
Creating a geodatabase
|
Three steps:
create a new geodatabase create a new Feature Dataset (assign coordinate information here which all data within has to comply to) add a new Feature Class (import shapefiles, raster, images etc) |
|
|
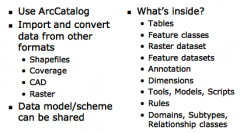
Geodatabase data management
|
|
|
|
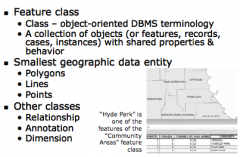
Feature class
|
|
|
|
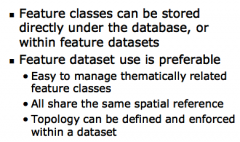
Feature datasets
|
|
|
|
Mosaic dataset
|
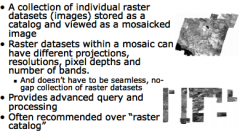
type of raster organization (w/ raster catalog)
|
|
|
Raster catalog
|
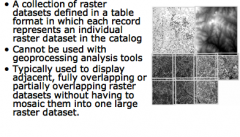
type of raster organization (w/ mosaic dataset)
|
|
|
Geodatabase topologies
|
|
|
|
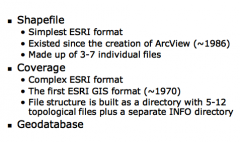
ESRI formats: what to choose?
|
|
|
|
ESRI formats cont'd
|
|
|
|
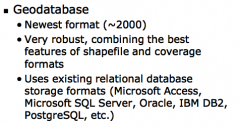
Why geodatabase is better
|
|
|
|
Why is data quality important?
|
A ton of people are using the internet now! That's a secondary source/ 'low quality' source of data
|
|
|
Who's responsible for data standards?
|
US govt standards have been regulated for a long time, but market standards are up to the user
|
|
|
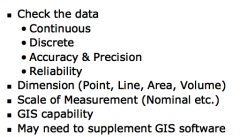
Data quality components
|

|
|
|
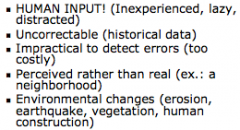
Sources of error
|
|
|
|
your only hope...
|
Metadata! Documentation of data, 'data about data'
Federal geographic data committee Readme.txt one example but ARCGIS uses .xml |
|
|
GIS Data principles
|
geospatial data is EXPENSIVE (US federal govt data only source to not charge; check before using!)
|
|
|
Distributed GIS
|
desktop-free GIS; server, handheld, web-enabled
|
|
|
Advantages of distributed GIS
|
platform free often (web browsers make the interface)
|
|
|
Other Country's GPS systems
|
GLONASS - russia, 21 satellites
Galileo - EU, 30 satellites, 2013 CHina on the ground versions: OnStar, Coast Guard, FAA, public works depts |
|
|
Handheld GPS capable devices
|
magellan, garmin, sprint, verizon, att&t
|
|
|
GPS error management
|
selective degradation -- govt reduces accuracy of signals to deny full access to unauthorized users - was supposed to be turned off May 2000
visible satellites -- ground-level obstructions can block signals / cause position errors signal multipath -- signals reflect off of objects, increasing travel time of signal and causing error receiver clock error -- built in clock not as accurate as on-board satellite atomic clocks orbital error -- satellite misreports its location atmospheric delays -- GPS receiver corrects for using algorithm w avg values satellite geometry -- relative position of satellites; best when satellites are at wide angles relative to one another can find computers (findmymac) or cell phones (the police, opencellID, navizon) with ground systems (wifi, cell phone towers) |
|
|
Important GPS contact
|
US coast guard navigation center, natl geodetic survey, FAA, GPS.gov
|
|
|
Civil engineering survey
|
Uses a theolodite or survey transit; records distance / elevation from known location with a stadia rod; trigonometry/ geometry determines size and shape of landscape
accuracy varies from manual equipment to laser guided automation |
|
|
Remote sensing
|
'the science of obtaining information through analysis of data acquired at a distance'
most common is aerial sensing or satellite data sensors collect portion of electromagnetic spectrum at certain pixel size (resolution) EM waves out of visible used, e.g. vegetation in IR is red but is green in 'visible' |
|
|
Remote sensing applications
|
land use mapping / land use change detection, natl disaster and risk mapping, global warming info, biodiversity info, landscape prediction/measurement (rainfall, temp, humidity), environmental/health problems (water salinity, pollution, oil spill)
|
|
|
Aerial photography
|
low fliers can produce sub-centimeter resolution; interpretation is 'art' but useful qualities are tone, size (pond v lake michigan), shape (geometry - > humanity usually), texture (cement v. forest), pattern/spatial arrangement (forest v. orchard), shadow (can help determine height and can also obscure things), site (do we expect sinkholes in central Canada?, association (do we usually see nuclear power plants in residential zones?)
|
|
|
Stereo photography
|
30 to 50 percent overlap, creates depth judgement by parallax in stereoscope
|
|
|
orthophotography
|
normal photo can't be used for mapping because of camera tilt and topography distortion; photo must be RECTIFIED into an ORTHOPHOTO (a uniform scale img),
transformed using math algorithm, ground control points, overlapping photos, and precise photography settings |
|
|
Satellite imagery
|
first used by govts for espionage;
1960 MetSats launched CORONA program 1960 - 1972, film had to be retrieved by planes, resolution 1 to 10 meters Gov't satellites now achieve 2-4 inch resolution different satellites capture different EM waves but most common are microwave, visible, UV, IR ADVANTAGES: efficient (dont have to send a team to remote areas), versatile (can be used by many disciplines) disadvantages: maybe expensive (if you need high-res img), learning curve -- need good software and good understanding of image analysis |
|
|
Landsat 7
|
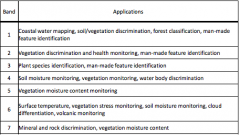
can collect seven images at once, each image shows specific band of EM spectrum
in order: blue-green, green, red, near IR, mid-IR, thermal IR, High IR |
|
|
Basic satellite image processing
|
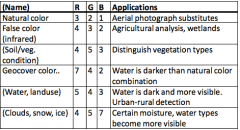
original images are in black and white; images typically 'composed' (stacked) and shown using primary colors
'False Color Img' combinations below software can derive data from these combos, and will assign classes to data based on combo labels |
|
|
Supervised vs unsupervised classification (in satellite imagery)
|
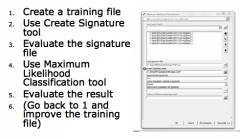
Supervised: create training file (identify sample groups/classes), create signature file using training file and image bands, evaluate signature file, classify (apply signature rules to unknown areas), interpret
Supervised classification steps below unsupervised: create signature file by identifying clusters using statistics, evaluate signature file, classify by applying the signature/rules to the whole area, interpret |
|
|
RADAR
|
is old, uses radio waves; can detect, range, and map objects like aircraft, rain, ships; adapted for mapping topography of land masses and bathymetry
|
|
|
LIDAR
|
LIght Detection And Ranging -- uses pulsed light to determine ground surface elevation with high vertical accuracy; comes back as 2D image
|
|
|
Street Address Geocoding
|
formats different for different countries... GIS doesn't interpet address directly and needs a database "lookup table" to match address against
|
|
|
Geocoding and Address Matching
|
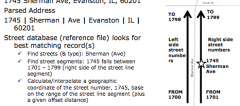
Geocoding is process of assigning a pair of approximate geographic coordinates to each case (e.g. address, zip code, place name, etc.)
Address matching is most common geocoding method, matches street addresses with reference street data; matching methods vary by country GEOCODING problems: new / irregular street addresses, expensive street reference data (international streets expensive) Solutions: instead of street, match by zipcode or city centroid; parcel matching, geocode with GPS |
|
|
Geocoding process in ARCGIS
|
Build a geocoding service (geocoder, locator) -- define method, reference data & fields, thresholds/criteria, and output data; run service against your table data; manual intervention / correction
lower quality geocoding service => higher geocoding rate (OPTIONAL / use with caution; geocode with second best spatial information, e.g. zipcode instead of street addresses) |
|
|
Reverse geocoding
|
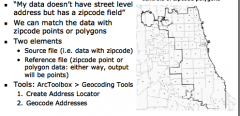
1. " I can't geocode a location because there aren't any nearby streets, but I know exactly where it is"
we can assign geographic coordinates by clicking on a map 2. " I know geographic coordinates but I want to know a street address for this location" By submitting geographic coordinates, some systems can assign closest address |
|
|
Reference (look-up table) sources
|
Traditional geocoding services require reference (geocodable streets) data
some options: census TIGER/ lines (Free but data must be processed), TeleAtlas (used by Google maps), NavTec (TA's rival, used by Yahoo Maps) |
|
|
Zipcode / City matching
|
|
|
|
Geocoding web services
|
can use ARCGIS pre-defined online geocoding;
advantages: no reference table necessary; disadvantages: limited geocodable cases in general (ARCGIS online publicly only 1000 cases at a time), not much control so need to examine results carefully |
|
|
What is a map?
|
A graphic depiction of all or part of a geographic realm in which real-world features are replaced with symbols at correct spatial location at reduced scale
|
|
|
Map function in GIS
|
storage, temporary communication, intermediate data check, final report
|
|
|
Map design
|
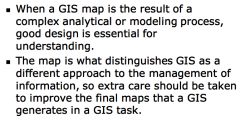
primary goals are to convey information, highlight patterns & processes, and to illustrate results
secondary goal is to create a pleasing and interesting picture A good map: looks good, is elegant and simple, leads to a map that is fit for the purpose Design influencers: purpose, reality, available data, map scale, audience, conditions of use, technical limits different media have different cartographic strategies (paper, film, mylar, monitor, digital projection, TV/movie) its ok to have gaps, but keep them on the upper area NOT the bottom; KISS, balance cartographers have designed hundreds of map types and choice depends heavily on data to be shown in the map figure; choosing the wrong map type can lead to misinformation and reduces communication effectiveness although symbolization can still be 'perfect' |
|
|
Cartographic elements
|
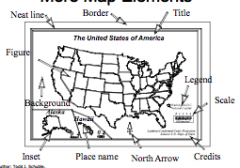
map body, inset/overview map, title, legend, scale, direction/orientation indicator, map metadata, background, border, neatline, inset, page coordinates, ground elements, graticule
|
|
|
Map Types: Point Data
|
|
|
|
Graduated symbols
|
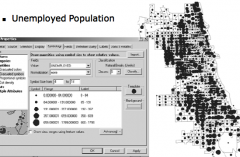
proportional symbols are similar to graduated symbols but represent quantity more accurately
|
|
|
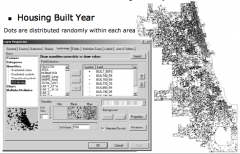
Dot density maps
|
|
|
|
Charts (pie, bar, stacked)
|
|
|
|
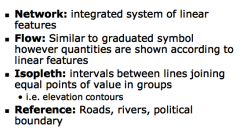
Map types: line data
|
|
|
|
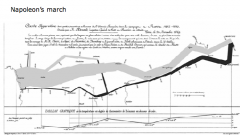
Famous flow map
|
|
|
|
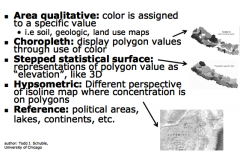
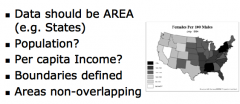
Map types: Area Data
|
|
|
|
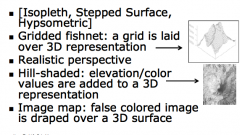
Map types: volume data
|
|
|
|
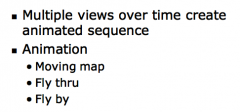
map types: time
|
|
|
|
Choosing map types
|
|
|
|
Data scaling
|
|
|
|
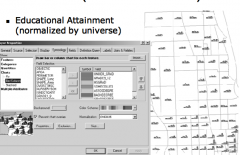
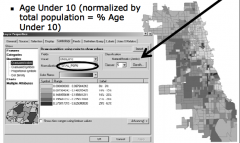
Example: cloropleth mapping
|
|
|
|
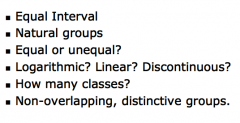
classification questions
|
|
|
|
Graduated (saturated) colors
|
|
|
|
Classifications
|
natural breaks (jenks) shown by jump in values on data scatter
Good for not-evenly-distributed values, but computing good break-points doesn't always work well quantiles: each class contains an equal number of features; good for evenly distributed values, also good for comparing area roughly the same size; not appropriate for different value sets as greatly different values can end up in the same class equal interval: each class has an equal range of values defined interval: each class has a specified interval value it's easy to understand but isnt appropriate for clustering values standard deviation: each class defined by distance from mean of values; it's good to see which features are above/ below mean but it's hard to understand w/o knowledge of stats |
|
|
Map design
|
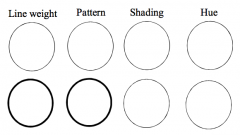
visual balance affected by: symbol 'weight', visual hierarchy of symbols and elements, relative location of objects on map
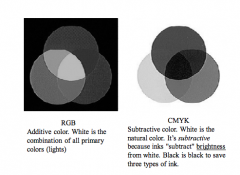
cartographic color conventions: land cover is brown, yellow or green; water is shades of blue; roads are red, white, gray, black, or green in arcgis: RGB (additive primaries), CMYK (subtractive primaries), HIS (hue intensity saturation values) -- saturation/intensity (sometimes 'lightness') maps better onto values than hue; usually for classification hue, saturation, intensity , simultaneous contrast (same color different background) human eye limited to about 12 various colors and 7 - 8 gradient colors color choice based on connotations, conventions, preferences, media |
|
|
Color impaired- friendly map
|

|
|
|
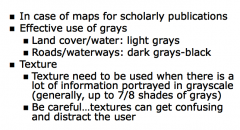
Cartographic conventions for scholarly publications
|
|
|
|
symbol 'weight'
|
|
|
|
Cartographic conventions for scholarly pubs - text
|
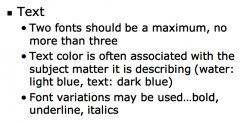
|
|
|
Cartographic conventions for text placement
|
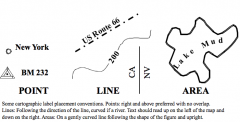
above-right is preferred location for city label, path right -> path down | V for words
|
|
|
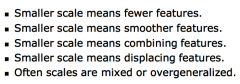
scales and generalization
|
|
|
|
Map design and GIS
|
|
|
|
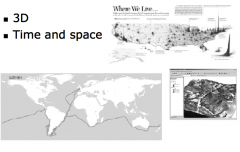
Geovisualization examples
|
|
|
|
Cartogram example
|
|
|
|
Dasymmetric map
|
|
|
|
Graphic editor software
|
|
|
|
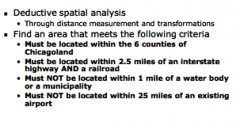
Spatial analysis
|
examine relationships between geographic features to describe and understand real world being represented
compare and contrast maps investigate variation over space predict future or unknown areas / features through modeling data modification and statistical measures are sometimes required spatial statistics has its own set of requirements and methods Tools for modifying data, identifying spatial relationships, and modeling integrated into GIS software |
|
|
Analytical approaches
|
testing for the existence of spatial structure, estimating model parameters, prediction of the 'unobserved'
|
|
|
Exploratory spatial data analysis
|
methods: visualization, numerical summaries, identification of spatial structure, investigation of spatial dependence
in the past 2 to 3 years, GIS analytic toolset has grown statistical modeling tools, spatial analytical tools real geographical phenomena are dynamic but GIS is static... time-slice and animation helps in this |
|
|
|
|
|
the THIRD airport!
|
|