![]()
![]()
![]()
Use LEFT and RIGHT arrow keys to navigate between flashcards;
Use UP and DOWN arrow keys to flip the card;
H to show hint;
A reads text to speech;
78 Cards in this Set
- Front
- Back
|
Cartography |
The discipline dealing with the conception, production, dissemination and study of maps in all forms. |
|
|
GIS used for particular values |
Location, Patterns, Trends, Conditions, Implications |
|
|
Happy Valley Ski Resort Uses Of GIS |
Specific feature location - facilities Geographic patterns - incidents Changes - snow cover patterns |
|
|
GIS helps search for sites |
Airports, Oil, Radioactive Waste, NIREX - Nuclear Industry Radioactive Waste Executive Analysis of spatial data |
|
|
Openshaw et. al (1989) |
Use of GIS for nature conservation, Process of digitizing. |
|
|
Functions of digitizing |
4 main data layers - geology, transport, nature, population. Combined with GIS - produce map and can be repeated easily for reevaluation. |
|
|
3 Issues with Openshaw et. al (1989) method |
1. Problem of errors in spatial data sets. 2. Difficulty in establishing criteria for abstract spatial concepts. 3. Potential value of using GIS to communicate ideas. Human judgement subjective, protected areas balancing human activities with tourism. |
|
|
Zdarske Vrchy - Czech Republic |
Landscape under pressure -> ill management Use of GIS for policy formation -> sustainable development. Bring DISPARATE data together with info about character of regions. e.g. bird species. |
|
|
GIS uses to help Zdarske Vrchy |
types of land use, presence of drainage, types of soil, topography. |
|
|
GIS uses to help Zdarske Vrchy |
paper maps, contour maps, add more data to area, predict areas to be restored as natural water reservoir. GIS brings together a wide range of data sources |
|
|
Problems with GIS in Zdarske Vrchy |
Data sources, different map projections Models of environmental processes Contrasting opinions - ecologist vs economist |
|
|
Finding a new home with GIS model |
Limited selection of data, questions asked define answers, human factors such as awareness and training, help user formulate questions. |
|
|
Many areas of application for GIS |
Socio economic - gov, defence agencies, commerce and businesses, utilities management, environmental management |
|
|
Define GIS 3 Components |
1. Computer System 2. Spatially Referenced Geo Data 3. Various management / analysis |
|
|
What should GIS Provide? |
Quick easy access to data, various abilities to analyse merge or update output capabilities for maps |
|
|
Main components of GIS |
Computer system -> OS Software Spatial Data Data Management |
|
|
System requirements |
Presence of decent processor Sufficient memory for data Good quality graphics Data input and output devices |
|
|
What is Spatial Data (Geographical Data)? |
Info about position, connections with other features and details about non spatial characteristics Latitude and Longitude as a geo reference Connection details |
|
|
Spatial Data Components |
|
|
|
What is Attribute Data (non spatial)? |
Wind Speed / Temperature |
|
|
Spatial referencing of data |
Flexible and robust for future use Represented using thematic layers Layer approach Representation of discrete objects object orientated approach -> telegraph poles |
|
|
Breakdown of geo-features |
3 Entities 1. Points - Spot Heights |
|
|
Raster Layer |
Continuous geographic phenomena - snow depth Applicable to Remote Sensing Data Space (entities, surfaces) represented by tessellations array of grid cells (usually square) Attributes (i.e. values) assigned to these cells define entities and surfaces |
|
|
Vector Layer |
Uses Cartesian coordinates (x, y) to represent spatial entities. Discrete geographic phenomena Vector lines and points |
|
|
Data input - Converting data to GIS usable data |
1. Graphical data -> real world -> Hotels in happy valley -> points 2. Non spatial attribute data -> tell computer what features represent -> set of points represents hotels. |
|
|
Data Management |
Facilitate use of Database Management Systems DBMS. Handle graphical and non graphical elements of spatial data. |
|
|
Transformation Of Spatial Data |
Changing the representation of a single entity or whole set of data. Changing errors as a result of digitizing. |
|
|
GIS Analysis Procedures |
1. Storage and Retrieval. Display of storage map. 3. Modelling procedures. Predictions of time and space |
|
|
Data in GIS |
Held in Layers, one for each feature -> road or building. |
|
|
Data Ouput |
Depends on cost constraints, audience, facilities. |
|
|
People In GIS |
Individuals / members of staff. Not all GIS successful. |
|
|
Spatial Data |
Data about the geography of the place |
|
|
Discrete data |
Data that have a distinctspatial extent (aka: entities / objects) e.g.Roads Building Fields |
|
|
Continuous data |
Data that occur everywhere (aka: fields) e.g. Atmospheric pressure Height Soil moisture content |
|
|
Vectors Vs Raster |
Vector is good for: Features that have discrete boundaries (e.g.a building) Raster is good for: continuous geographic data (e.g. temperature) Spatial analysis and modelling Data collected on a regular grid (e.g. satellite data) |
|
|
Why is GIS used? |
Analysis thatwould not be possible/economical Reduce the time needed to solve problemsProcess data volumes that would otherwise beimpossible Reduce errors Support objective decision making Be easily kept up-to-date |
|
|
Location Component |
Where is it? How big is it? Requires a common spatial coordinate system e.g. What isthe National Grid location of my house? |
|
|
Attribute Component |
What is it?What other properties does it have?e.g. How many rooms does my house have? How manypeople live there? What is the social status of theresidents? What is the household income? |
|
|
Data Classifications |
Primary Vs. Secondary Discrete Vs. Continuous Vector Vs. Raster |
|
|
Primary Data |
Direct observatione.g. Ground survey (totalstation, GPS etc) Remote sensing Ground survey |
|
|
Secondary Data |
Digitising data collectedby someone elsee.g.Digitising a paper map Scanning an aerialphotograph Heads up digitization |
|
|
Networks |
Connected lines that don't form polygons e.g. Road Network, direction may be important flow. |
|
|
Polygons |
Closed Lines - Residential |
|
|
Points |
Simplest entity, Simple (x,y) pair |
|
|
Surfaces |
Mesh of coordinates (e.g. elevations) |
|
|
Attributes |
Spatial entities linked to their attributes Attribute table -> attribute info Enables analysis |
|
|
Scale & Generalisation |
Appropriate symbology controlled by scale. Point to represent city. Number of points used to represent features -> loss of information vs time and storage costs |
|
|
Limitations Of Vector Data |
Duplication of points among shared boundaries No info about links in networks No info about objects within other objects |
|
|
Topology |
The connections between entities Can overcome the limitations Store the geometric information separately fromthe topological information Enables more sophisticated analysis |
|
|
Scale & Generalisation (Raster) |
Size of grid cell important for accurate model of feature... …but more data storage neededDoubling the resolution increases storage requirement by fourtimes Various computer storage strategies for reducing the spacerequired |
|
|
Raster Data Model |
Cell value determined according to attribute atlocation represented by cell (e.g. land use,rainfall) Each cell has a single value representing theattribute May represent discrete or continuous data |
|
|
Raster Representation Of Data |
But what happens if a cell contains more thanone attribute? Greatest share (area) allocation (>1 lines/polygonsin one cell) Centre point allocation (>1 points in one cell) |
|
|
Raster Data Values |
100 values for every pixel 32 values within run length encoding |
|
|
GIS use what type of data? |
Spatial Data |
|
|
There must be an agreed |
Spatial frame of reference
|
|
|
Geodesy |
The discipline that deals with the measurement and representation of the earth |
|
|
Ellipsoidal Earth |
Can be modelled as an Oblate Ellipsoid (formed by rotating an ellipse about one of its axis) Locations specified with reference to mathematical model Earth isn't a perfect ellipsoid |
|
|
Models of the Earth |
GRS80 Geodetic Reference System 1980 (fits whole world) (GPS)
|
|
|
Coordinate Systems |
Longitude / Latitude Rectangular Cartesian Coordinates |
|
|
Geodetic Datum |
Conventions defining how coordinates relate to Earth. Together with maths of ellipsoid define Geodetic Datum Relation between real world and conceptual coordinate system |
|
|
Datum consists of: 8 parameters |
The 3-D location of the origin (three parameters) The 3-D orientation of the axes (three parameters) The size of the ellipsoid (one parameter) The shape of the ellipsoid (one parameter) |
|
|
Example of Geodetic Datum |
World Geodetic System 1984 Basis of GPS locations Based on GRS80 ellipsoid Zero longitude defined as prime meridian ofBureau International de l‘Heure in 1984 Zero latitude defined as equator in 1984 |
|
|
Geodetic Datum needs a realisation aka. |
Terrestrial Reference Frame (TRF) e.g. OS Trig points, GPS satellite constellation |
|
|
Terrestrial Reference Frame (TRF) subject to errors |
The WGS84 TRF is accurate to ~5 cm The datum is error free (by definition) |
|
|
Features on OS maps aredetermined with Ordnance Survey GreatBritain 1936 (OSBG36)datum and TRF |
OSBG36 based on Airy 1830 ellipsoid
|
|
|
TRF Triangulation |
1936 -1953 |
|
|
Transforming between datums |
Positioning done using GPS GPS is based on the WGS84 datum Use a GPS receiverto plot position on OS map on OSGB36 We need to transfrom the coordinates from onedatum to another |
|
|
Transforming between datums with function |
GPS receivers actions. GPS find position relative to WGS84 TRF with more precision than the OSGB36 TRF Approx. |
|
|
Defining Height |
Earth’s surface above or below ellipsoid - Ellipsoidal height: distance between the ellipsoidand ground surface (perpendicular to the ellipsoid surface) But this is not what we normally mean by ‘height’ |
|
|
Experience uphill and downhill based on what? |
Gravity field of the Earth. May not be parallel to ellipsoidal surface |
|
|
A ‘level’ surface is perpendicular to the Earth’slocal gravity field |
The geoid is that surface with the same‘height’ throughout the world |
|
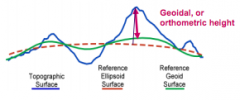
Geoid |
Complex surface Separation between geoid and any ellipsoid varies in a complex way |
|
|
Vertical datum needed to compare heights (constant) |
An arbitrary point at which height is defined aszero All heights are measured relative to this pointUsually based on a tide gauge |
|
|
OSGM02 Geoidal Model |
Heights on OS maps are ‘orthometric heightsrelative to Ordnance Datum Newlyn’ The datum is realised by a TRF consisting ofbenchmarks scattered around the UK |
|
|
Heighting |
Done by GPS Ellipsoidal heights WGS84 datum |
|
|
Geoid model use |
A Geoid model is needed to specify the pattern of differences between the Geoid and ellipsoid Usually based on gravity measurements Different Geoid models will give different ‘heights’at a particular location |
|
|
TRF realises ODN has errors |
OS has produced a Geoidmodel in which acorrection for the errors inthe ODN TRF areincluded OSGM02 Geoid model |
|
|
Lecture 3 Summary |
GIS (and all mapping) requires an agreed spatialreference frame British mapping is based on the OSGB36 andODN datums and their corresponding TRFs |