Reading...
![]()
Play button
![]()
Play button
![]()
Use LEFT and RIGHT arrow keys to navigate between flashcards;
Use UP and DOWN arrow keys to flip the card;
H to show hint;
A reads text to speech;
26 Cards in this Set
- Front
- Back
|
What is validity?
|
Validity: How well the survey, biological test, or study approximates what it purports to measure.
**the ability to test what it supposed to measure** Absence of systematic error (or bias) Not affected by sample size Internal Validity: The extent to which the investigator’s conclusions correctly describe what happens in the study sample **point etsimate, CI & how close am i** External Validity: The extent to which the investigator’s conclusions are appropriate when applied to the universe outside the study **ability of the sample to be applied to other pops** |
|
|
What is reliabililty?
|
Reliability: The precision and reproducibility of the data collected.
Strongly influenced by variability ( unlike validity) Called random error ** Very influenced by sample size** |
|
|
What is more important internal or external validity?
|
internal
|
|
|
What influences external validity?
|
Levels of subject selection:
Target Population: population to which results can be applied Source Population: the population, defined in general terms and enumerated if possible, from which eligible subjects are drawn Eligible Population: the population of subjects eligible to participate Study Participants: those people who contribute data to the study Downward; direction of subject selection Upward: direction of application of results |
|
|
In a study assessing the exposure between alcohol intake (high vs. low) and high blood pressure the investigator calculated the following results:
RR = 2.13 (1.05 - 12.10) p = 0.01 CONCLUSIONS? PROBLEMS? |
P-value:
We have observed an association that is significantly different than the null hypothesis (RR=1) and the probability that an observed effect is actually due to chance is 1 in 100. Confidence Interval: If we did this study 100 times (took 100 different samples from the target population) approximately 95% of the time the interval would cover the true population measure. |
|
|
Sources of error (random or systematic)
Error can be introduced by the… |
Study observer/investigator
Study participant Study instrument |
|
|
Sources of error (random or systematic)
During the process of… |
Selection of study subjects
Measurement of disease and/or exposure Analysis or interpretation of findings |
|

What type of source of error am i?
|
Random error affects precision(RELIABILITY)
|
|

What type of source of error am i?
|
Systematic error (bias) affects VALIDITY
|
|
|
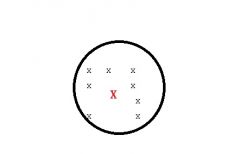
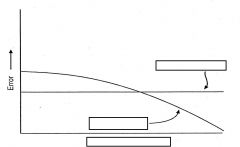
describe the images
|
want high reliability and high validity
low reliability and high validity - need more n low reliability and low validity - reliablity study might pick up on this high reliability and low validity - nightmare |
|
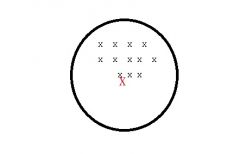
identify and describe issues
|
high reliability and high validity - desired
low reliability and high validity - need more n low reliability and low validity - reliability study might pick up on this high reliability and low validity - nightmare |
|
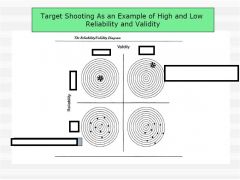
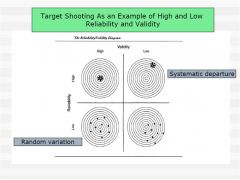
describe chart
|
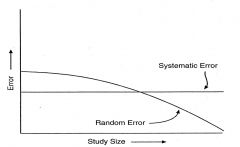
random error - measuring correctly, just need more N
as sample size increases, random error decreases, systemic error stays the same |
|

How can an observed E/D association be spurious?
|
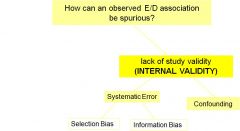
systemic error can lead to reduced internal validity
confounding distinct from bias but produces same result |
|
|
How do we prevent threats to validity (systematic error) in our research?
|
1) Study design: Minimize Bias
(more on this in upcoming lectures) 2) Study implementation: Quality Assurance & Quality Control 3) Use “validated tools” (best if validated in your population) |
|
|
Study Implementation: Quality Assurance (QA)/Quality Control(QC) - Threats to error and ways to reduce.
|
QA Activities (before data collection starts):
Development or identification of validated data collection instruments Development of Manual of Procedures (outlines standardized data collection procedures) Staff Training QC Activities (after data collection starts): Field Observation Validity Studies * *note* During the study, validity studies can be used to assess performance of an already validated tool. Remember, if the tool has not already been validated, this should be done in a pilot study before your main study |
|
|
Assessing Validity of Measurement Tools: (the accuracy of data collected )
|
In validity studies, measurements can be compared with a “gold standard” to calculate:
Correlation Coefficients (Pearson’s / Spearman’s) Sensitivity and Specificity Caution: --> be careful in extrapolating results from one population to another --> the “gold standard” may not be valid itself. |
|
|
Assessing Validity of Measurement Tools: Categorical Variables
What is Sensitivity? |
Sensitivity: The ability of a test to identify correctly those who have the disease (or characteristic) of interest (a/(a+c))
|
|
|
Measurement Tools: Categorical Variables
What is Specificity? |
Specificity: The ability of a test to identify correctly those who do not have the disease (or characteristic) of interest (d/(b+d))
|
|
|
Ways to increase reliability:
|
1. Reduce intra-subject variability
-Repeated Measurements -Standardized data collection times 2. Reduce inter-observer variability -Standardized diagnostic criteria, tests, and instruments 3. Increase sample size |
|
|
Ways to assess reliability
|
Inter-rater : % agreement, kappa statistic
Internal consistency: Kuder-Richardson20 , Cronbach’s coefficient alpha Test-retest - Quantified by correlation co-efficient *See book for more examples* |
|
|
Ways to assess agreement between observers, instruments, etc.
|
Percent (observed) agreement : proportion of measurements that have the same results by two (or more) methods, expressed as a percentage
- % agreement =(a+d) / (a+b+c+d) Kappa measure: the extent to which 2 measures agree, taking into account their agreement expected by chance alone (ex: agreement if two assessors rated responses at random) |
|

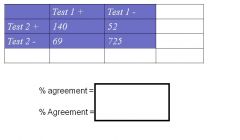
How do you Calculate % (observed) agreement
|
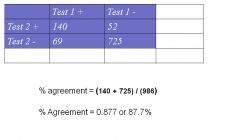
% agreement = (140 + 725) / (986)
% Agreement = 0.877 or 87.7% |
|
Calculate % chance agreement
|

Expected value for Test1+/Test 2 + --> (cell a) = (209*192) / 986 = 40.7
Expected value for Test1-/Test 2 - --> (cell d) = (777*794) / 986 = 625.7 |
|

Calculate Kappa
|

Kappa = (%obs agreement - % chance agreement)/(1 - % chance agreement)
= [((140 + 725)/ 986)– ((40.7+ 625.7)/ 986) ] / [1 –(40.7+625.7)/986 )] = (0.877 – 0.676)/ (1 –0.676) = 0.62 |
|
|
How do you evaluate Kappa?
|
Values of kappa range from –1 to 1:
If kappa = 0, observed agreement same as chance alone If kappa < 0, observed agreement worse than by chance alone If kappa = 1, observed agreement = 100% (perfect!) In medical research: k > 0.75 --> excellent 0.40 < k < 0.75 --> good 0 < k < 0.40 --> marginal/poor |
|
|
Validity or Reliability?
Precision Confidence Interval Systematic Error Reproducibility Bias Random error Sample size Confounding |
Precision -R
Confidence Interval -R Systematic Error - V Reproducibility - R Bias - V Random error - R Sample size - R Confounding - V |