![]()
![]()
![]()
Use LEFT and RIGHT arrow keys to navigate between flashcards;
Use UP and DOWN arrow keys to flip the card;
H to show hint;
A reads text to speech;
96 Cards in this Set
- Front
- Back
- 3rd side (hint)
|
Is the fit of a model better or worse when the squared error is smaller |
Better |
|
|
|
3 ways to enter predictors into a model |
Hierarchical Forced entry Stepwise |
|
|
|
What is stepwise |
When predictors are entered into a model based on a criteria (semi-partial correlation with the outcome) |
|
|
|
Issue with stepwise |
Can produce spurious results (false/fake) Can be arbitrary which predictor should go in first, bad decision at the start can spiral Getting dressed example |
|
|
|
What does standardizing parameter estimates allow for? |
Comparison between them, see which has more of an effect (have to look at the b values and actual context tho) |
|
|
|
What's another name for mean squared error? |
Variance |
|
|
|
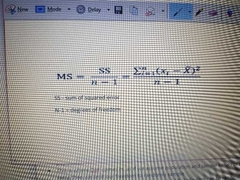
What's the equation for the mean squared error? |
|
|
|
|
What is SST |
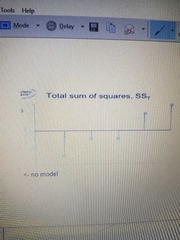
Total variability (between scores and the mean - whole cake) |
|
|
|
What is SSR |
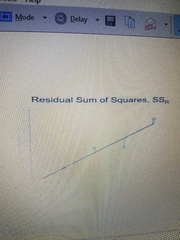
Residual/error variability (half of cake) |
|
|
|
What is SSM |
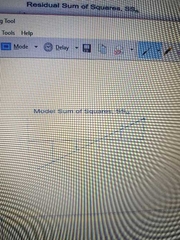
Model variability (dif in variability between the model and the mean, part of cake) |
|
|
|
What is the F ratio |
Ratio between SSR and SSM MSM / MSR |
|
|
|
What is R^2 |
The proportion of variance accounted for by the model Correlation between observed and predicted scores How big is the slice of cake relative to the model in relation to the whole cake, what proportion of the original variability is the model explaining by fitting it SSM/SST |
|
|
|
What is the adjusted R^2 |
An estimate of the R^2 in the populations |
|
|
|
What is adjusted R^2 |
An estimate of R^2 in the populations |
|
|
|
What are confidence infervals |
Intervals that contains the 'true' population value of the parameter in 95% of samples |
|
|
|
How big does n need to be to assume the sampling distribution is normal? |
About 150 |
|
|
|
How to calculate the confidence interval |
Lower bound = Mean - 1.96 × SE Upper bound = Mean + 1.96 × SE |
|
|
|
What is a type 1 error |
Reject a true null hypothesis Not pregnant but say they are If 0.05 gets bigger, increases error False positive |
Positive or negative comes first? |
|
|
What is a type 2 error |
Failure to reject a null hypothesis that is actually false. Reject alternative hypothesis but it does not occur due to chance If 0.05 gets smaller, error increases False negative |
What comes first, negativity or positivity? |
|
|
4 ways to see the effect size |
The parameters, b Standardized b Pearsons r Cohen's d |
|
|
|
Pearsons r effect size cut offs |
0.1 = small 0.5 = large |
|
|
|
Cohen's d effect size cut offs |
0.2 small 0.8 large |
|
|
|
How to calculate Cohen's d |
Difference in means divided by SD (pooled or control) |
|
|
|
How to calculate the SD pooled |

|
|
|

What are these called? |
Influential cases |
|
|
|
3 ways to detect outliers and influential cases |
Graphs Standardized residuals Cooks distance |
|
|
|
Above what value is a standardized residual likely to be an outlier? |
3 or above |
|
|
|
Above what value of cooks distance is cause for concern? |
1 and above |
|
|
|
What are the key assumptions of the linear model |
Linearity and additivity Spherical residuals (Homoscedasticity errors, independent errors) Normality (residuals) Sampling distribution |
|
|
|
What is linearity and additivity |
Relationship between predictor and outcome is linear The combined effect of predictors is additive |
|
|
|
How to test linearity and additivity |
Look at graphs |
|
|
|
What does independent errors mean |
The error is prediction (residulas) for one case should not be related to the error in prediction for another case (autocorrelation) |
|
|
|
What does homoscedasticity mean |
Varience of errors (residuals) consistent at different values of the predictor variable |
|
|
|
What does it mean if the spherical errors assumption is violated? |
b values are unbiased but not optimal Standard errors are incorrect meaning t-tests, p values and confidence intervals will also be incorrect |
|
|
|
How to detect spherical errors |
Graph of standardized residuals: ZRESID against standardized predicted ZPRED |
|
|
|
What is heterogeneous variance |
Where variances are different at different points |
|
|
|
In the GLM, does the data have to be normally distributed |
No, normality if residuals and Sampling distribution important |
|
|
|
In the GLM, does the data have to be normally distributed |
No, normality if residuals and Sampling distribution important |
|
|
|
If the residuals are not normally distributed, what does this mean? |
Doesn't really matter b will be unbiased and optimal (I.e. will minimize the variance) but there may be classes of estimator that are more accurate |
|
|
|
Why is normality of sampling distribution important? |
P values associated with bs of the model assume the test statistic associated with them follows a normal distribution Also, confidence intervals for bs are constructed using a quartile from a null distribution assumed to be normal |
|
|
|
If residuals are not normally distributed, what do you use |
Central limit theorem, increased sample size makes it more normal, issues of normality goes away |
|
|
|
What graphs can be used to explore normality? |
Histograms Boxplots P-P/Q-Q Plots |
|
|
|
Above what value shows skew |
2.5 |
|
|
|
What is the Kolmogorov-Smirnov (K-S) test |
A bad test of normality |
|
|
|
4 robust estimations for correcting problems |
20% trim M-estimators The bootstrap Adjust SE or test statistic for heteroscedacity |
|
|
|
Method of the bootstrap |
Gets a sample from your sample Gets value, puts it back, etc until the same n as your sample Repeats 1000 times Order value and work out which fall in 95% Gives a CI based in the data of the sample not population, no issues in normality |
|
|
|
What does the F statistic show |
If the predictor help to improve our ability to predict the outcome |
|
|
|
Equation for F |
F = MSM/MSR |
|
|
|
In dummy coding, what does b0 mean? |
The mean of the control or 'zero coded' group |
|
|
|
In dummy coding, what does b1 mean? |
The difference between the 2 variables |
|
|
|
How do you test the difference between two groups to see if its significant? |
T-tests |
|
|
|
Equation for the mean squared error |
MS = SS/df |
|
|
|
What 2 things can correct Heteroscedacity |
Welch Brown-Forsythe |
|
|
|
2 reasons to do contrast coding over dummy coding |
Control the error rate - make sure its 5% across all sig tests across all of model Want to override what SPSS automatically gives you |
|
|
|
What is another name for contrast coding |
Orthogonal contrast |
|
|
|
Opposite test to contrast coding |
Post hoc tests |
|
|
|
Is the contrast coding planned/hypothesis driven |
Yes |
|
|
|
What are post hoc tests |
Multiple t-tests with adjusted p-values |
|
|
|
When you have ordered means, what could you use to compare them? |
Trend analysis |
|
|
|
Why is dummy coding error rates not independent |
Uses the control, or category 0 more than once |
|
|
|
How many contrast should there be? |
K-1 Should always end up with 1 less contrast than the number of groups |
|
|
|
What are the 4 rules to coding planned contrasts |
1. Groups coded with a +ve vs groups coded with a -ve 2. Sum of weights for a comparison should be 0 3. If a group is not involved in a comparison, assign it a weight of 0 4. For a given contrast, the weights assigned to the group(s) in 1 chunk of variation should be equal to the number of groups in the opposite chunk of variation |
|
|
|
General linear equation for the contrast model |
Y = bhat 0 + bhat 1(contrast 1) + bhat 2(contrast 2) + E |
|
|
|
Are constrast coding or post hoc tests better n why? |
Contrast coding, much better to be theory driven and design and test theories in a scientific way |
|
|
|
What is the problem with post hoc tests |
Inflates the type 1 error rate, comparisons of all means Increases chances of false positive |
|
|
|
Solution to the issue of post hoc issue |
Adjust the alpha (or test statistic) to be more conservative Bonferroni However/ lose power to detect differences |
|
|
|
Name for comparing means adjustong for other predictors using a linear model |
Analysis of covariance ANCOVA |
|
|
|
2 advantages of ANCOVA |
Can reduce error variance (explains some SSR) Greater experimental control (gain greater insight into the effect of the predictor variable) |
|
|
|
When do you bootstrap |
When there's no normal distribution/sample is small |
|
|
|
What is a covariate? |
A continuous predictor |
|
|
|
What does it mean if a covariate shows heterogeneity of slopes |
Relarionship between predictor and covariate is not consistent across groups - cannot interpret the effect of the covariate as it changes between predictors |
|
|
|
What is SPSS's name for dummy coding |
Simple contrast |
|
|
|
What means should you look at if including a covariate |
Adjusted |
|
|
|
If the interaction is significant between IV and covariate, what does that mean |
Assumption of homogeneity broken, BAD |
|
|
|
What is a factorial design |
More than 1 IV/predictor variable that has been manipulated |
|
|
|
Benefit of factorial designs |
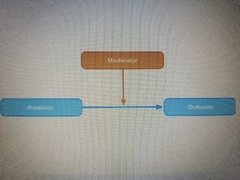
Can look at moderation interactions effects |
|
|
|
Equation for factorial design |
Outcome = b0 + b1 predictor + b2 moderator + b3 interaction + E |
|
|
|
If there is a significant interaction, what do you consider about the main effect? |
Ignore it |
|
|
|
Benefits of repeated measures design |
Sensitivity (unsystematic variance is reduced, more sensitive to experimental effects) Economy (less ppts needed) |
|
|
|
What assumption does a repeated measures design violate? |
Independent residuals |
|
|
|
How do you correct for repeated measures breaking the assumption of independent residuals |
Impose extra assump - the assumption of sphericity Estimate degree it breaks, then adjust the DoF by amount it violates the assumotion |
|
|
|
What is the assumption of sphericity |
Means the correlation between treatment level is the same Assumes variances of differences between conditions is equal |
|
|
|
The assumption of sphericity is adjusted for using what 2 things |
Greenhouse-Geisser estimate Huynh-Feldt estimate |
|
|
|
If the GG or HF estimates are 1, what does this mean |
Data is perfectly spherical |
|
|
|
What do you multiply the GG or HF estimates by to correct for the effect of sphericity? |
df |
|
|
|
What is the difference between GH and HF |
GG conservative (safer) HF liberal |
|
|
|
What does the lower bound estimate show in assumption of sphericity |
Lowest value possible value that sphericity could be, given the data |
|
|
|
What are the follow-up tests you can do after repeated measures |
Built in contrasts (e.g. simple contrasts) Post hoc tests: H/ only 3/18, bonferroni |
|
|
|
What does the bonferroni test do |
Correcting test statistic so across all tests you do, the alpha rate never rises above 5% as thats what you have it set as |
|
|
|
What does ANOVA stand for? |
Analysis of Variance |
|
|
|
If you have categorical outcomes, what do you predict? |
Log odd of the outcome occuring |
|
|
|
What is b when you have categorical outcomes |
The change in the log odds of the outcome associated with a unit change in the predictor |
|
|
|
If b1 is less than one in categorical outcomes, what does this mean? |
Predictor ^, prob of outcome occuring v |
|
|
|
If b1 is more than one in categorical outcomes, what does this mean? |
Predictor ^, prob of outcome occuring ^ |
|
|
|
Methods to add parameters to the model in categorical outcomes |
Forced entry (variables added simultaneously) Hierarchical (enterd in blocks based on past research) Stepwise (SPSS based on stat criteria) |
|
|
|
2 unique problems with categorical outcomes |
Incomplete info (inflates SE) complete separation (when the outcome variable can be perfectly predicted, messes up SE, model completely nonsensical) |
|