![]()
![]()
![]()
Use LEFT and RIGHT arrow keys to navigate between flashcards;
Use UP and DOWN arrow keys to flip the card;
H to show hint;
A reads text to speech;
56 Cards in this Set
- Front
- Back
- 3rd side (hint)
|
A subset of the population that is being studied |
Sample |
|
|
|
A person or object that is a member of the population being studied |
Individual |
|
|
|
Characteristics of the individuals within the population |
Data/variables |
|
|
|
Numerical summary of a population |
Parameter |
|
|
|
Numerical summary of a sample |
Statistic |
|
|
|
Type of statistics that consists of organizing and summarizing data and describes data through numerical summaries, tables, and graphs |
Descriptive statistics |
|
|
|
Type of statistics that uses methods that take a result from a sample, extends it to the population, and measures the reliability of the result |
Inferential statistics |
|
|
|
Type of data/variable which classifies individuals based on some attribute or characteristic: identification |
Qualitative variables |
|
|
|
Type of data/variable that provides numerical measures for individuals. Arithmetic operations can be performed on these values and provide meaningful results |
Quantitative variables |
|
|
|
Type of quantitative data that is countable and finite |
Discrete |
|
|
|
Type of quantitative data that is measured |
Continuous |
|
|
|
Process of using chance to select individuals from a population to be included in the sample; equally likely |
Simple random sampling |
|
|
|
Type of sampling obtained by separating the population into nonoverlapping groups called strata and then obtaining a simple random sample from each stratum. The individuals within each stratum (group) should be similar in some way |
Stratified sample |
|
|
|
Type of sampling obtained by selecting every kth individual from the population. The first individual selected corresponds to a random number between 1 and k; spreads out the sample to increase randomness |
Systematic sampling |
|
|
|
Sampling obtained by selecting all individuals within a randomly selected collection or group of individuals. Groups do not have to be similar |
Cluster sampling |
|
|
|
Sample in which individuals are easily obtained and not based on randomness |
Convenience sampling |
|
|
|
Lists each category of data and the number of occurrences for each category of data |
Frequency distribution |
|
|
|
The proportion of observations within a category |
Relative frequency |
|
|
|
Lists each category of data together with the relative frequency |
Relative frequency distribution |
|
|
|
Categories of data |
Classes |
|
|
|
The ____ of a class is the smallest value within the class |
Lower class limit |
|
|
|
The ____ of a class is the largest value within a class |
Upper class limit |
|
|
|
The ____ is the difference between consecutive lower class limits |
Class width |
|
|
|
The three measures of spread |
Range, variance, standard deviation |
|
|
|
The three measures of center |
Mean, median, mode |
|
|
|
The empirical rule |
68, 95, 99.7 |
|
|
|
A histogram or table is an example of (descriptive or inferential) statistics |
Descriptive |
|
|
|
One can make reasonable guesses using (descriptive or inferential) statistics |
Inferential |
|
|
|
List of all possible outcomes |
Distribution |
|
|
|
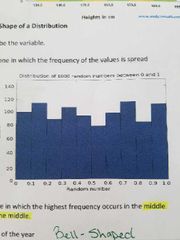
___ distribution is when the frequency of the values is spread evenly |
Uniform (symmetric) |
|
|
|
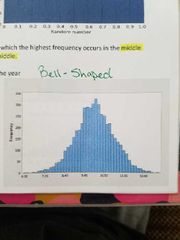
___ distribution is when the highest frequency occurs in the middle and frequencies tail off the left and right |
Bell-shaped (symmetric) |
|
|
|
Is money discrete or continuous? |
Discrete because it's countable |
|
|
|
Symbol for population mean |
Mew |
|
|
|
Symbol for population size |
N |
|
|
|
Symbol for sample mean |
X bar |
|
|
|
Symbol for sample size |
n |
|
|
|
The measure of center that divides data in half |
Median |
|
|
|
How to find median of even numbered data set |
Take the mean of the middle two numbers |
|
|
|
Relationship of mean and median when distribution is skewed left |
Mean < median |
|
|
|
Relationship of mean and median when distribution is skewed right |
Mean > median |
|
|
|
Shape of distribution when mean=median |
Symmetric |
|
|
|
The measure of spread best used to describe skewed data |
Median |
|
|
|
True or false: an observation is the mode just because it repeats. |
False: the mode is an observation that occurs the MOST |
|
|
|
Phrase indicative of a sample instead of a population |
Randomly selected |
|
|
|
The sum of all deviation about the mean usually equals ___, so finding the deviation mean this way would be impossible. How is this solved? |
Zero. By taking the average of the SQUARED deviations (variance) |
|
|
|
How do you find the standard deviation? |
By taking the square root of the variance |
|
|
|
The sum of the squared deviations |
Variance |
|
|
|
Average deviation about the mean |
Standard deviation |
|
|
|
Empirical rule |
68-95-99.7 rule helps summarize and describe data set |
|
|
|
Term for data lying outside of two standard deviations from the mean |
Unusual |
|
|
|
Z score Formula |
X - mean/standard deviation |
|
|
|
Population variance formula |
Sum of all deviations squared/N |
|
|
|
Sample variance formula |
Sum of all deviations squared / n-1 |
|
|
|
Symbol for population standard deviation |
Sigma |
|
|
|
Symbol for population standard deviation |
Sigma |
|
|
|
Symbol for sample standard deviation |
S |
|