![]()
![]()
![]()
Use LEFT and RIGHT arrow keys to navigate between flashcards;
Use UP and DOWN arrow keys to flip the card;
H to show hint;
A reads text to speech;
62 Cards in this Set
- Front
- Back
|
(1)Statistics |
A field of study that measures, organizes, and interprets data |
|
|
Data |
Information/results |
|
|
Empiracle field |
Truths that are based on evidence/data |
|
|
Descriptive Statistics |
Involves using numbers to condense or describe a larger group of numbers |
|
|
Inferential Statistics |
Involves researchers drawing conclusions or making inferences about a large group of numbers based on the data from a smaller sub-group of numbers |
|
|
Population |
Each and every member of a defined group; impossible to deal with all at the same time |
|
|
Sample |
A sub-group of the population that can be mamanged |
|
|
Random sample |
Each and every member of the population has an equal probability of being selected for the inclusion in the sample; impossible to achieve |
|
|
Parameters |
Pulling numbers from the population; numerical characteristics of a population |
|
|
(2) Statistics |
numerical characteristics of samples |
|
|
Sampling Error |
the discrepancy btw a statistic and its corresponding parameter |
|
|
Biased Sample |
both over select and under select from certain subgroups in the population |
|
|
Variable |
anything that changes or varies |
|
|
Quantitative |
variable dealing with amount |
|
|
Qualitative |
variable not involving amounts |
|
|
Real Limits |
refers to the range of possible values for a score on a quantitative variable |
|
|
Nominal Scale |
-using numbers as labels or names -no indication of value -qualitative and nominal are the almost interchangeable |
|
|
Ordinal Scale |
-allows us to distinguish one thing from another -some indication of value; more or less of something being measured -lacks equal intervals |
|
|
Interval Scale |
-has a value indication/allows distinction -equal intervals/spacing btw score values -does not have a true zero point |
|
|
Ratio Scale |
-allows distinction/indication of value/equal intervals -expresses a true zero point |
|
|
S.S. Stevens |
Who came up with the 4 scales of measurement? |
|
|
Lord |
Who argued with Stevens about the scales of measurement? |
|
|
"Numbers don't know where they came from." AKA quit relying on the scale, instead use your brain to extract as much meaning from the data as possible |
What was Lord's argument? |
|
|
Correlational Research |
type of research where the goal is to describe the degree of association btw two or more variables |
|
|
Experimental Research |
Research where the goal is to determine a cause and effect relationship between two variables |
|
|
Surveys |
type of research with a standardized list of questions |
|
|
Naturalistic Observation |
Research where the variables are recorded as they change in their natural habitat |
|
|
Case Study |
research used extensively in the medical community; defined as a highly detailed investigation of a single person |
|
|
Operational Definitions |
specifying in precise terms, exactly what is meant by each of the variables |
|
|
Confounding/Extraneous Variables |
variables other than the IV, that could potentially impact the DV |
|
|
Mean |
arithmetic average that finds the balance point |
|
|
x̄ = ( Σ x ) / n
|
Formula for the mean |
|
|
Interval and ratio scales |
Which scales of measurement is the mean appropriate for? |
|
|
Median |
the middle most score; equal number of scores that fall below and above it |
|
|
Ordinal Scale |
Which scale of measurement is appropriate for the median? |
|
|
Mode |
the most often occurring score |
|
|
Nominal |
The mode is the only measure of central tendency that can be used for the... scale of measurement |
|
|
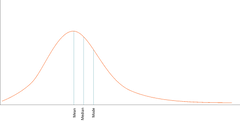
Normal Distribution |
symmetrical distribution with an asymptotic tail that is also called the bell curve; 3 measures of central tendency are all equal |
|
|
Asymptotic tail |
never reaches the abscissa but gets closer and closer into infinity |
|
|
Normal Distribution |
Distribution in which we assume fits the population because of its high frequency of occurrence |
|
|
Positively Skewed Distribution |
Distribution in which there is a disproportionately large numbers of low scores and a few extreme high scores |
|
|
Positively Skewed Distribution
|
|
|
|
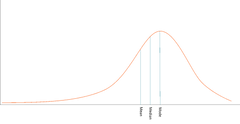
Negatively Skewed Distribution |
Distribution in which there is a disproportionately large number of high scores and a few extreme low scores |
|
|
Negatively Skewed Distribution
|
|
|
|
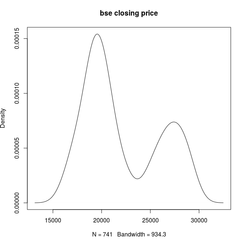
Bi-modal Distribution |
A distribution in which there are 2 curves or 2 modes in the data set; 2 high frequency sets of scores |
|
|
Bi-modal Distribution |
|
|
|
Measures of Central Tendency |
Mean, Median, Mode |
|
|
Measures of Variability |
Range, Inter Quartile Range, Variance, and Standard Deviation, |
|
|
Range |
the distance btw the highest and lowest scores in a distribution |
|
|
(1) XH - XL = (2) ULXH - LLXL = |
Formulas for the range |
|
|
Inter Quartile Range |
the distance btw the 3rd and the 1st quartile |
|
|
Ordinal |
The range and inter quartile range are the appropriate measures of variability for the... scale of measurement |
|
|
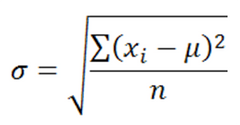
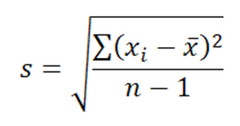
Standard Deviation |
most widely used measure of variability that is the approximation of the average distance of scores from the mean |
|
|
formula for population standard deviation |
|
|
formula for a sample standard deviation |
|
|
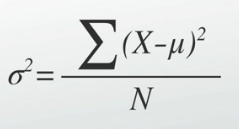
Variance formula |
|
|
Variance |
a measure of how spread out a data set is
|
|
|
1. Change raw scores into deviation scores (X- μ) 2. Square the Deviation Scores 3. Calculate the sum of squares [Σ (x - x̄)2] 4. Analysis of Variance 5. Take the square root of the variance |
The Five steps to finding population variance |
|
|
underestimate |
samples tend to underestimate/overestimate the variability in the population |
|
|
Z-scores |
Specifies the precise location of its corresponding raw score within a distribution; the sign of the *blank* indicates whether the raw score is above or below the mean, while the absolute value of the *blank* indicates the number of standard deviations btw the raw score and the mean |
|
|
Standardize |
What do Z-scores do to the data? |
|
|
z = (x – μ) / σ [Population]
z = (x – μ) / S [Sample] |
Z-score formulas |