Reading...
![]()
Play button
![]()
Play button
![]()
Use LEFT and RIGHT arrow keys to navigate between flashcards;
Use UP and DOWN arrow keys to flip the card;
H to show hint;
A reads text to speech;
49 Cards in this Set
- Front
- Back
|
ANOVA
|
Hypothesis testing procedure for studies with three or more groups
|
|
|
One-way ANOVA
|
One categorical independent variable
One continuous dependent variable |
|
|
Within-groups estimate of the population variance
|
Average each sample’s estimate of the population variance into one single pooled estimate
- combined variation of the groups studied |
|
|
Between-groups estimate of the population variance
|
Estimate of the variance of a population of individuals based on the variation among the means of the groups being studied
|
|
|
F ratio
|
Between-groups population variance estimate to the within-groups population variance estimate
Between-groups:Within-groups |
|
|
how to compute within-groups estimate of the population variance (S^2 within or MS within)
|
find S^2 within or MS within which = S^2 one + S^2 two + S^2 three +… S^2 last / (divided by) N groups
|
|
|
How to Compute between-groups estimate of the population variance
|
find S^2M which = Σ (M – GM)2 / dfbetween =
then to find S^2 between multiply S^2M (n) = |
|
|
dfbetween =
|
Ngroups -1
|
|
|
S^2M
|
estimated variance of the distribution of means
|
|
|
GM =
|
Grand Mean
the overall mean of your scores, or mean of your means GM = (ΣM)/Ngroups |
|
|
F Ratio
|
F = S^2 between / S^within
|
|
|
Between-groups degrees of freedom
_______________________________________ Within-groups degrees of freedom |
df between(numerator)
_________________________ df (denominator) |
|
|
Hypothesis testing w/ analysis of variance
|
1) restate the Null, and research hypothesis
2) Determine the characteristics of the comparison distribution (an F distribution for analysis of variance) 3)Determine the cut off at which the null can be rejected 4) Determine your sample's score on the comparison distribution (determine the F ratio for the sample) 5) decided weather to reject the null (if the F ratio is larger than the cutoff we can reject the null |
|
|
Planned contrasts
|
Particular means to be compared are decided in advance
|
|
|
Post-hoc comparison
|
Exploratory analysis after an ANOVA
Most popular: Scheffé Test |
|
|
Factorial ANOVA
|
Way of organizing a study in which the effects of two or more variables are studied at once by making groupings of every combination of the variables
ex: a 3 x 2 factorial design, relationship status: married, dating, single (x) gender: male, female |
|
|
Main effect
|
Difference between groups in one variable in a factorial design in analysis of variance
|
|
|
Interaction effects
|
A combination of variables have an effects that could not be predicted from the effects of the variables individually
|
|
|
Correlation
|
Association between scores on two variables
Equal-interval numeric variables |
|
|
Scatterplot
|
One variable is represented by the x-axis (horizontal)
One variable is represented by the y-axis (vertical) Allows us to see the relationship between the 2 variables of interest |
|
|
Linear correlation
|
Scatter diagram roughly approximates a straight line
|
|
|
Curvilinear correlation
|
Scatter diagram does not approximate a straight line but instead follows a systematic pattern (or a complex curve)
|
|
|
Positive Correlation
|
variables go in the same direction; highs go with highs and lows go with lows. Increase or decrease together (go in same direction)
|
|
|
Negative Correlation
|
low scores on one axis are paired with high scores on the other, middle scores with middle scores, and high scores paired with low scores.One increases other decreases (go in opposite directions)
|
|
|
Correlation Coefficient
|
Range from +1 to -1
|
|
|
Cross-product of Z scores
|
Multiplying a person’s Z score on one variable by the person’s Z score on another variable
|
|
|
Correlation Coefficient (r)
|
r = sum of ZxZy / N
measure of degree of linear correlation between two variables raning from -1 (perfect negitive correlation) through 0 (no correlation) to +1 (perfect positive correlation). |
|
|
How to computing statistical significance of a correlation coefficient
|
t = ________r_______
√(1 −𝑟2)/(𝑁−2) |
|
|
Correlation Matrix
|
Report of correlation coefficients among several variables
|
|
|
Correlation does NOT imply causation
|
there may be a 3rd variable, which causes both X and Y
however, If X preceded Y, then you can be confident that Y cannot cause X |
|
|
Correlation =
|
Relationship
|
|
|
Regression =
|
Prediction
|
|
|
How we make predictions for an individual on one variable
|
based on knowledge of their score on a second variable
If we are using X to predict Y: X = predictor variable Y = criterion variable |
|
|
Prediction using Raw-Scores
|
To predict a raw score for the criterion variable (Y):
Multiply the predictor variable (X) by the raw-score regression coefficient (b) and then add a number called the regression constant (a) Y = Xb + a |
|
|
Prediction using Z scores
|
To predict a Z score for the criterion variable (Y):
Multiply the Z score for the predictor variable (X) by the standardized regression coefficient (β) Y = Zxβ |
|
|
Slope
|
Amount that the line moves up for every unit it moves across
|
|
|
Intercept
|
The point where the regression line crosses the vertical axis (y axis)
Regression constant |
|
|
Multiple Regression
|
Use when there are multiple predictor variables
Suppose we believe that SAT scores, IQ, and high school GPA will all predict cumulative college GPA: Y = College GPA X1 = SAT score X2 = IQ score X3 = High school GPA |
|
|
Bivariate vs. Multiple Regression
|
In bivariate regression, standardized regression coefficient (β) is equal to the correlation between the predictor and the criterion
In multiple regression, (β) refers to the amount of unique contribution of the given predictor to the criterion variable There is likely to be some overlap among the predictors |
|
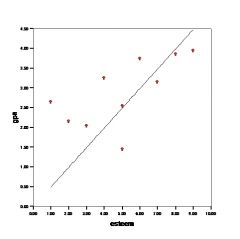
What kind of relationship does this show
|
Linear Correlational Relationship
|
|
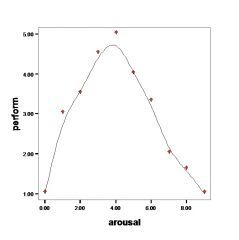
What relationship does this graph show?
|
Curvilinear Correlational Relationship
|
|
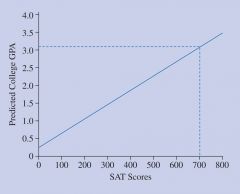
What type of line does this graph represent
|
Linear Regression Line
|
|
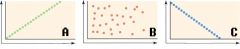
What are the three different correlations displayed
|
A) Perfect Positive Correlation (+1.00)
B) No Relation (0.00) C) Perfect negative correlation (-1.00) |
|
|
Predictor variable (usually X)
|
Variable used to predict scores of a individual on another variable
|
|
|
Criterion Variable
|
Variable being predicted
|
|
|
Regression Constant (a)
|
in a linear prediction rule, a = particular fixed number added to the prediction
|
|
|
Regression Coefficient (b)
|
Number multiplied by a person's score on a predictor variable as a part of linear prediction rule
|
|
|
Linear Prediction Rule (or Model)
|
Formula for making predictions; that is, formula for predicting a person's score on a criterion variable based on the person's on predictior variable(s).
|
|
|
Standardized regression coefficient
|
regression coefficient in standard deviation units it shows the predicted amount of change in SD units of the criterion variable if the value of the particular variable increased by 1 SD
|