![]()
![]()
![]()
Use LEFT and RIGHT arrow keys to navigate between flashcards;
Use UP and DOWN arrow keys to flip the card;
H to show hint;
A reads text to speech;
167 Cards in this Set
- Front
- Back
- 3rd side (hint)
|
What are the research methods we need to know of for this paper. |
The experimental method Observation Self report Correlational studies Case studies Content analysis |
Research methods |
|
|
Outline the experimental method |
The manipulation of variables that can determine cause and effect relationships |
Research methods - Experimental methods |
|
|
Define the IV and DV |
The IV is the independent variable - I.E what is changed / altered The is the dependent variable I.E what is measured from the change |
Research methods - Experimental methods |
|
|
Define opperationalisation |
The process of defining variables into measurable factors such as opperationalising 'anger' 'good weather' Alone they are ambiguous but when operationalised it can be measured and defined. |
Research methods - Experimental methods |
|
|
Define an extraneous variable |
This is a variable that 'could' affect the DV. They are controlled so that they don't vary across (effect) any of the experimental conditions or between participants. |
Research methods - Experimental methods |
|
|
Define Confounding variables |
If an extraneous variable is uncontrolled it will become a confounding variable and actually change results. |
Research methods - Experimental methods |
|
|
What three main types of extraneous variables are there? |
Participant variables - This is the participants characteristics such as their age or inteligence Situational variables - The surrounding environment and experimental setting such as the noise level or temperature, or even familiarity. Experimenter variables - This may be the appearance, personality or conduct of the researcher, such as a male or female researcher |
Research methods - Experimental methods |
|
|
Define a demand characteristic |
interaction between participant and researcher may affect the results. The participants may *guess the purpose of the research and try to please the researcher by giving the 'right results' *Guessing the purpose of the research and annoy the researcher, sometimes known as the 'screw you effect' *Acting unnaturally out of nervousness or fear of evaluation *acting unnaturally due to social desirability bias. |
Research methods - Experimental methods |
|
|
Name a procedure that reduces demand characteristics |
The single blind procedure where the participants have no idea which condition they are in. In a drug trial they wouldn't know if they were drug or placebo. |
Research methods - Experimental methods |
|
|
Define investigator effects |
A researcher may unconsciously influence the participants responses' |
Research methods - Experimental methods |
|
|
Outline three ways investigator effects can occur. |
*Physical characteristics such as age, ethnicity or gender. *Less obvious personal characteristics - eg an accent, tone of voice. *Unconscious bias - They may be bias in their interpretation of data. |
Research methods - Experimental methods |
|
|
Name a type of procedure that might reduce investigator effects |
The double bind procedure where neither the participant or investigator knows which condition the participants are in. |
Research methods - Experimental methods |
|
|
What are the 4 types of experiments |
Lab Field Quasi Natural |
Research methods - Experimental methods |
|
|
Outline and evaluate Lab experiments |
Performed in a controlled environment . There is a standardised procedure with participants randomly allocated to conditions. +High degree of control +Replicable +reliable +Cause and effect relationships +Isolation of variables - Experimenter bias -Problems with operationalizing the IV and DV - Demand characteristics |
Research methods - Experimental methods |
|
|
Outline and evaluate Field experiments |
They occur in real world settings rather than in a lab. The IV is manipulated but extraneous variables are controlled as much as possible. + high ecological validity + less demand characteristics - Less control - harder to replicate - Ethical issues |
Research methods - Experimental methods |
|
|
Outline and evaluate Natural experiments |
This is where the IV occurs naturally such as weather or a time of year. The researcher measures the effect on the DV. + High ecological validity + no demand characteristics - less control - Ethics - Less replicable - Sample bias |
Research methods - Experimental methods |
|
|
Outline Quasi experiments |
This is where the IV comes from within a person such as their smoking status or Gender The DV is then measured from that. Used when unethical to manipulate the IV. |
Research methods - Experimental methods |
|
|
Outline an observational technique |
This is the watching and recording of behaviour. Most of these observations happen in a naturalistic setting but can still occur in a controlled condition. (eg Milgram's study) |
Research methods - Observation |
|
|
Define participant and non participant observations |
Participant - This is where the observers become activly involved in the situation and gain a more hands on perspective (eg Zimbardo) Non participant - This is where researchers are not actively involved in the behaviour being studied such as Ainsworth's strange situation. |
Research methods - Observation |
|
|
Outline what a covert or Overt observation is |
An overt observation is where participants are aware that they are being studied. A Covert observation is where the participants don't know they are being observed. |
Research methods - Observation |
|
|
Evaluate observational techniques |
+ high external validity + Can be used when an experiment is unethical + Can be used where co-operation of participants is unlikely. + there are fewer demand characteristics in covert non participant observations - Can't infer cause and effect relationships - Observer bias (this can be reduced via interobserver reliability) - Can't always be replicated - May be unethical - Practical problems in remaining unobserved. |
Research methods - Observation |
|
|
Define and outline behavioural categories |
This a means of recording behaviour in a naturalisic observation. An example is observing drivers coding their driving into 'safe' or 'unsafe' by looking for 'distracted driving' or 'concentrating' etc. |
Research methods - Observation |
|
|
What is a sampling procedure |
This is the method of recording observed data. Evant sampling - is how many times a behaviour occurs. Time sampling - is counting different behaviour in a set time frame eg every 30 seconds |
Research methods - Observation |
|
|
Define inter-observer reliability |
This is when independent observers code behaviour in the same way. This lessons the chances of observer bias where the observer may be subjective . Inter-observer reliability needs to be decided before the observation begins so that behavioural categories are clearly defined and don't overlap. |
Research methods - Observation |
|
|
Give an example of an observation |
A covert, non participant observation on anger - Participants don't know they're being studied - Opperationalise anger' IE. Violence, shouting and body language - Create the behavioural categories (Ie. When the participant hits someone) - Use event sampling - have numerous researchers observe the participants. |
Research methods - Observation |
|
|
Define a self report technique |
This is where the participants give information about themselves without researcher interferance |
Research methods - self report |
|
|
What are the two main self report methods? |
Questionnaire (open and closed questions) Interviews (structured and unstructured) |
Research methods - self report |
|
|
Outline closed and open questions used in questionnaires |
Open questions allow participants to answer questions in their own words and get a greater depth of answers. However they are harder to analyse. Closed questions are fixed and involve 'yes or no' answers such as 'are you a smoker' They are easier to quantify but restrict participants answers |
Research methods - self report |
|
|
Evaluate The use of questionnaires |
+ they are quick + Lack of researcher effects because researchers needn't be present + Quantitative and Qualitative analysis + Replicate - Misunderstanding (might not understand the questions) - Biased samples (some people may be more or less likely to fill in a questionnaire) - low response rate - superficial issues (closed questions aren't always suitable for sensitive issues) - social desirability / idealised answers (participants may life in order to give answers that are expected.) |
Research methods - self report |
|
|
Outline how a questionnaire could be constructed |
Aim - if there is an exact aim. Writing questions will be easier Length - Questionnaires should be short and to the point Previous questionnaires - use examples of previous questionnaires that were successful as a basis for the design. Question formation - Questions should be concise, unambiguous and easily understood. Pilot study - Questionnaires should be tested on people who can provide honest feedback on all aspects of the design of the questionnaire Measurement scales - Some questionnaires use scales to assess characteristics eg in level of agreement of disagreement. send - send out to numerous people |
Research methods - self report |
|
|
Define an interview |
A self report method where participants answer questions in a 'face to face' setting. Eg Bowlby's 44 theives |
Research methods - self report |
|
|
Outline the three main types of interview |
Structured - Involves identical closed questions being read to participants with the interviewer writing down answers. Don't need much training, easy to conduct. Unstructured - Involves an informal discussion on a particular topic. Interviewers can explore interesting answers by asking follow up questions. Interviewers need to be trained and skilled in order to do this. Semi structured - involves a combination of structured and unstructured techniques, producing quantitative and qualitative data. |
Research methods - self report |
|
|
Evaluate interviews |
+ Complex issues (Unstructured interviews can discuss complicated or sensitive issues) + Ease misunderstandings (questions can be explained) + Data analysis (Semi structured interviews produce both types of data. which an be analysed) + Replication (standardised interviews can be replicated) - Interviewer effects (may unconsciously bias answers, subject to demand characters and social desirability bias) ] - Ethical issues (true purpose of the interview) - participant answers (may be difficult for some participants to answer) |
Research methods - self report |
|
|
Outline the design of interviews |
The characteristics of the interviewer need to considered Age Gender Ethnicity Personal characteristics and adopted roles. |
Research methods - self report |
|
|
Define a correlational study |
The factors measured in a correlational study to assess their direction and strength of relationship. Measures the strength and direction of co-variables. EG locus of control and obedience or sunniness and ice cream sales |
Research methods - correlational study |
|
|
Define a co-variable |
The variables investigated in a correlation. They are not referred to as the independent and dependent variables because the study is investigating the relationship between them, not trying to show a cause and effect. |
Research methods - correlational study |
|
|
Outline a positive or negative correlation |
Positive correlations are where one co-variable increases the other. EG good weather and ice cream sales A negative correlation is where one co-variable decreases the other. |
Research methods - correlational study |
|
|
Describe the graph used to represent correlational data |
Scattergrams/scattergraphs one co variable on each axis. the points on a graph will depend on if it is a positive or negative correlation. and is measured from a -1 (perfectly negative correlation) to a +1 (a perfect positive correlation) |
Research methods - correlational study |
|
|
Evaluate correlational studies |
+ allows for predictions to be made + Allows the quantification of relationships + no relationships needed - Quantification problems (levels of significance can't always be seen) - Can't establish cause and effect relationships - Extraneous relationships may influence the covariables - Only works for linear relationships. ( Can't show curvilinear relationships) Eg level of arousal. |
Research methods - correlational study |
|
|
Define an Aim |
A precise statement of why a study is taking place It should include 'what is being studied' and 'what the study is trying to achieve' |
Research methods - The scientific process |
|
|
Define a hypothesis |
A precise, testable, prediction of what is expected to happen. must include the IV and DV. |
Research methods - The scientific process |
|
|
Define an experimental / alternative hypothesis |
Predicts that the change in the DV will be significant. Statistical tests are used to see if the results are significant. *Experimental hypothesis = the experimental method *Alternative hypothesis = Other methods |
Research methods - The scientific process |
|
|
Define a null hypothesis |
Predicts that the IV will not affect the DV. Any differences will be because of chance and not because of the IV. |
Research methods - The scientific process |
|
|
Outline the two types of experimental / Alternative hypothesis
|
Directional (one tailed) = Predicts the direction of the experiment. It predicts the direction of results. (Used when a previous study has suggested results) Non directional (two tailed) = Predicts that there will be a difference but doesn't predict the difference. (Used when the study has never been done) |
Research methods - The scientific process |
|
|
Define sampling |
The selection of participants to represent a wider population. |
Research methods - The scientific process |
|
|
Outline random sampling |
Each member of a population has an equal chance of being selected. One way to achieve this is to place all names from the target population into a container and draw out the required sample. The results are selected in an unbiased fashion. |
Research methods - The scientific process |
|
|
Evaluate random sampling |
+ Unbiased selection (there is no bias in selection) + Generalisation (Sample should be fairly representative) - Impractical (difficult to achieve) - not representative (unbiased selection doesn't guarantee an unbiased sample, for example, all female could be randomly selected. |
Research methods - The scientific process |
|
|
Outline oppourtunity sampling |
Involves selecting participants who are available and willing to take part eg people passing in the street. sears 1986 found that university students found that 75% of university studies use undergrads simply for convenience |
Research methods - The scientific process |
|
|
Evaluate oppourtunity sampling, |
+ Ease of information - easy to create as they use people who are already availible. + Natural experiments - usually used with this kind of sample. - Unrepresentative (likely to be biased and therefore not generalisable) -Self selection - option to decline to take part and thus turns into a self selecting (volunteer) sample |
Research methods - The scientific process |
|
|
Outline volunteer or Self selected sampling |
This is where people volunteer to participate in a study, often by replying to adverts |
Research methods - The scientific process |
|
|
Evaluate volunteer or self selected sampling |
+ Ease of information (requires little effort) + Less chance of the 'screw you' phenomenon - unrepresentative (there will be bias) - Demand characteristics (participants may be eager to please) |
Research methods - The scientific process |
|
|
Outline systematic sampling |
This is taking every 'nth' person in a list to create the sample. This involves calculating the size of the population and then assessing what size the sample needs to be to work out what the sample interval is... Out of 1000 people, and a sample of 20 is required it will be every 50th name from the list |
Research methods - The scientific process |
|
|
Evaluate systematic sampling |
+ Unbiased selection + Generalisation - Periodic traits (if the nth term coincides with a trait then the sample will be biased) - Not representative (doesn't guarantee unbiased sample) |
Research methods - The scientific process |
|
|
Outline stratified sampling |
This is a small -scale reproduction of a population. It involves dividing a population into characteristics important for the research. Eg age, social class etc. the population is randomly sampled within each stratum. EG is 12% of the population is 20-30 years old. 12% of the sample should be 20-30 years old |
Research methods - The scientific process |
|
|
Evaluate stratified sampling |
+ representative + Unbiased - needs a knowledge of population characteristics - time consuming |
Research methods - The scientific process |
|
|
Define a pilot study |
A small scale practice investigation It identifies where potential problems with the design, method or analysis so they can be fixed. Participants may also suggest appropriate changes, eg participants guessed the aim of a study. |
Research methods - The scientific process |
|
|
Name the three main types of experimental design |
Independent groups, Repeated measures Matched pairs design |
Research methods - The scientific process |
|
|
Outline the independent groups design |
participants only do one experimental condition |
Research methods - The scientific process |
|
|
Evaluate the independent groups design |
+ No order effects + Less chance of demand characteristics + Time is saved - More participants are needed - There may be differences between the two group conditions. which is minimised via random allocation |
Research methods - The scientific process |
|
|
Define repeated measures design |
Each participant is tested in all of the conditions of the experiment, they are therefore tested against themselves |
Research methods - The scientific process |
|
|
Evaluate the repeated measures design
|
+ Group differences - As the same people are measured in all conditions there are no participant variables between the conditions + More data and fewer participants - order effects (They may be fatigued, guess the aim or improve due to practice) Counterbalancing can be used to alter this (AB-BA) - Demand characteristics - guess the aim of the study and act accordingly - Takes more time, time may be taken between each condition. |
Research methods - The scientific process |
|
|
Outline the matched pairs design |
A type of repeated measures design. different but similar participants are used in each condition. They're matched on characteristics important for a particular study such as age. Monozygotic twins are often used as they are a perfect matched pairs |
Research methods - The scientific process |
|
|
Evaluate the matched pairs design |
+ No order effects + less chance of demand characteristics +Group differences (less chance of participant variables affecting results) - More participants are needed - matching is difficult (almost impossible to get it perfectly matched) - time consuming |
Research methods - The scientific process |
|
|
Define ethical issues |
The rules governing the conduct of researchers in investigations * The health and dignity of participants should be protected |
Research methods - The scientific process - Ethics |
|
|
What is in the code of ethics? |
*Participants should have informed consent *avoid deception *protection of participants *right to withdraw *Confidentiality / anonymity *observational research *incentives to take part |
Research methods - The scientific process -Ethics |
|
|
Outline informed consent |
- They should have enough information to be able to consent. Parental consent should be obtained for under 16's. Informed consent can't be gained from those under the influence of alcohol or drugs or mentally unfit to consent |
Research methods - The scientific process - Ethics |
|
|
Outline Avoidance of perception |
- If a participant is likely to show unease when debriefed then they shouldn't be deceived. However sometimes deception is necessary to avoid demand characteristics. If so deception must be dealt with. |
Research methods - The scientific process - Ethics |
|
|
What types of consent help counteract deception |
*Presumptive consent - gained from a similar background of participants. If they say they'd do it then if can be assumed that actual participants will too. *Prior general consent - Participant agreeing to be deceived without knowing how they will be deceived. *Retrospective consent - Involves asking participants for consent after they have participated (but its a bit pointless) |
Research methods - The scientific process - Ethics |
|
|
Outline protection from harm |
Protect from physical and psychological harm. must be no greater than general life |
Research methods - The scientific process - Ethics |
|
|
Outline right to withdraw |
Participants should be aware that they can leave a study at any time, and can withdraw data after the study is finished |
Research methods - The scientific process - Ethics |
|
|
Outline confidentiality / anonymity |
Participants data should not be disclosed to anyone unless agreed in advance. Numbers should replace names. Confidential data collection is preferable in cases where participants might be followed up later |
Research methods - The scientific process - Ethics |
|
|
Outline the code of ethics in regards to observational research |
'Observations are only made in public places where people might expect to be observed by strangers' |
Research methods - The scientific process - Ethics |
|
|
Outline code of ethics in regards to incentives to take part |
Participants should not be offered bribes or promised rewards for their participation as this puts pressure on them to take part. |
Research methods - The scientific process - Ethics |
|
|
Outline implications of psychological research for the economy |
Psychological research has allowed for therapies for those with mental illnesses. This help reduce costs for society in general. Especially cost to the NHS... Therefore the cost of Ethics vs the cost on society as a whole... |
Research methods - The scientific process - Ethics |
|
|
Evaluate ethics in psychological research |
*as well as contributing to the economy by producing a better functioning workforce, psychological research also cuts down costs on health services and other institutions *When conducting research, psychologists need to be aware that ethical considerations come before profit and that psychology shouldn't be used to exploit people. *Psychologists must alto care to not become divorced from the consequences of their research by being in the agentic state and not taking responsibility for their actions. |
Research methods - The scientific process - Ethics |
|
|
Outline reliability |
The extent to which a test or measure produces consistent results. internal reliability is where something is consistent within itself. External validity concerns the extent to which a test measures consistently over time |
Research methods - The scientific process - Reliability |
|
|
Outline the ways of assessing reliability |
*The split half method - The test (eg questionnaire) is literally split in half. If the test results are similar then it is internally reliable. * The test - retest method - Gives the same test to the same participants on two occasions, if the same result is obtained then reliability is established * Inter-observer reliability different observers view and rate behaviour in the same way. This can be done by correlating scores. |
Research methods - The scientific process - Reliability |
|
|
Define Validity |
The extent to which results accurately measure what they claim to measure. Internal validity - Whether the results are due to the IV and not confounding results can be improved by reducing investigator affects, minimising Demand characteristics and standardising instructions and random sampling. *External validity The extent to which results can be generalised to other settings. (population, ecological and temporal validity) |
Research methods - The scientific process - Validity |
|
|
Outline 4 ways of assessing validity |
Face validity - The extent to which items look like what a test claims to measure. Concurrent validity - Assess validity by correlating scores on a test with another test known to be valid predictive validity - Assess validity by predicting how well a test predicts future behaviour, eg do school entrance tests predict later exam results Temporal validity assesses to what degree research findings remain true over time Temporal validity |
Research methods - The scientific process - Reliability |
|
|
Outline the features of science |
Replicability Objectivity Falsification Theory construction and hypothesis testing Paradigm shifts |
Research methods - The scientific process - What is a science |
|
|
Define the scientific process |
A means of acquiring knowledge based on observable, measurable evidence |
Research methods - The scientific process - What is a science |
|
|
Define Replicability |
Being able to repeat a study to check the validity of the results If one can keep repeating a study and get the same results every time then it is more valid and reliable. The test is less likely to be a fluke |
Research methods - The scientific process - What is a science |
|
|
Define Objectivity |
Observations are made without bias and personal opinions. By using standardised instructions, operational definitions of observed variables and and physically defined measurements of performance etc. This help reduce bias. |
Research methods - The scientific process - What is a science |
|
|
Define Falsification |
The idea that scientific statements are capable of being proven wrong. You can't falsify Freud's psychodynamic which is why it is unscientific. |
Research methods - The scientific process - What is a science |
|
|
Outline theory construction and hypothesis testing |
Tentative theories as being the first stage of the scientific process. There is the Inductive phase where observations yield information that is used to formulate theories as explanations Then there's the Deductive phase where predictions are made from theories in the form of testable hypothesis, are tested and yield data that is analysed, leading to theory adjustment This means that laws and principles can be created and form paradigms |
Research methods - The scientific process - What is a science |
|
|
Define a paradigm |
A paradigm is a “worldview” or a set of assumptions about how things work. Rossman & Rollis define paradigm as “shared understandings of reality” Quantitative and qualitative research methods involve very different assumptions about how research should be conducted and the role of the researcher. |
Research methods - The scientific process - What is a science |
|
|
Outline Kuhn's theory of science |
Kuhn argued that Popper's idea of a scientific method isn't how science works. He suggests that scientists collect data that fits the accepted assumptions of a science. This is a type of bias where scientists attempt to find examples of confirming their hypothesis rather than refuting them. This is done with scientific journals and focusing upon confirmatory examples rather than non confirmatory |
Research methods - The scientific process - What is a science |
|
|
Outline Popper's theory of science |
He proposed the hypothetico
-deductive model of science and is credited with advancing empirical falsification into scientific methods and procedures. He stated that no matter how many positive validations of a scientific theory occur through experimental testing. it doesn't prove it as undeniably true. |
Research methods - The scientific process - What is a science |
|
|
Define a paradigm shift |
This is when there is a paradigm of belief (I.e the sky is blue) but there is information that is contrary to this paradigm.
When there is enough evidence that goes against this belief. It causes a paradigm shift. |
Research methods - The scientific process - What is a science |
|
|
How does one report a psychological investigation? |
scientists need to present their findings in a conventional manner. This includes *'what was done, why, what was found and what that means' 2)Table of contents 3) Abstract 4) Intro 5) aims 6) Hypothesis 7) procedure/method 8) findings / results 9) Discussion 10) Conclusion 11) references 12) appendicies |
Research methods - The scientific process - Scientific reports |
|
|
Outline the requirements of a title |
This should be clear, relevant and fully informative |
Research methods - The scientific process - Scientific reports |
|
|
Outline the requirements of a table of contents |
This is optional But best included with page numbers |
Research methods - The scientific process - Scientific reports |
|
|
Outline the requirements of an 'Abstract' |
This is a summary of research. The abstract generally consists of two sentences each on the theoretical background (previous research), aims and hypothesis, methodology, results, conclusions and suggestions for future research. |
Research methods - The scientific process - Scientific reports |
|
|
Outline the requirements of an Introduction |
This details why the study was conducted. General theoretical background, controversies and previous investigations of the chosen topic are covered Only relevant material should be used. A 'funnel' technique is used starting off with a broad theoretical perspective, which then narrows down to the precise study area and leads on to the aims and hypothesis. |
Research methods - The scientific process - Scientific reports |
|
|
Outline the requirements of an Aim |
The overall 'aims' should be stated clearly , precisely and concisely |
Research methods - The scientific process - Scientific reports |
|
|
Outline the requirements of a Hypothesis |
The experimental/alternative hypothesis and the null hypothesis are stated, precisely and unambiguiously. A justification of the direction of hypotheses (one tailed or two tailed) is also included as is the level of significance which is normally 5% / P < 0.05 |
Research methods - The scientific process - Scientific reports |
|
|
Outline what is required of the Procedure/methods |
The design Participants Apparatus/materials Standardised procedure Controls |
Research methods - The scientific process - Scientific reports |
|
|
What should be included in the Design section of the 'procedure' part of the scientific report |
The design should include: *The choice of technique (eg time sampling) *Identification of Variables, IV and DV + Extraneous variables) *Ethical considerations |
Research methods - The scientific process - Scientific reports |
|
|
What should be included in the Participant section of the procdure part of a scientific report? |
It should include Sampling details: *Target population in terms of variables eg Age, gender etc *Sampling method eg opportunity *Actual sample - how many participants etc *The naivety of the sample *If any participants declined or dropped out *Allocation of participants to the testing conditions |
Research methods - The scientific process - Scientific reports |
|
|
What should be included in the Apparatus section of the procedure part of a scientific report? |
The aparatus should include a description of any technical equipment involved and how it was used. Only materials directly relevant to the investigation are included. Mark schemes, questionnaires go in the appendices |
Research methods - The scientific process - Scientific reports |
|
|
What should be included in the 'standardised procedure' of a scientific report? |
This consists of a step by step procedure, allowing replication of the study.
This includes details of where the study took place, any standardised instructions and debriefing procedures. If instructions are lengthy they can be placed in the appendices and are referenced here. Material detailed in the method section is not repeated here. |
Research methods - The scientific process - Scientific reports |
|
|
What should be included in the control section of a procedure part of a scientific report? |
This details controlls of counterbalancing, random allocation of participants to groups. Single or double blind procedures, control of extraneous variables and what steps were taken to avoid bias in the sampling or experimental procedures. |
Research methods - The scientific process - Scientific reports |
|
|
What is a requirement of the findings/results section of the scientific report? |
They involve the presentation of what was found in terms of the data collected . This occurs as abbreviated or summary versions of the raw data. Written in words with the support of tables and/or graphs |
Research methods - The scientific process - Scientific reports |
|
|
Outline what descriptive statistics are in the findings and results section of a scientific report |
This is where key findings are briefly described in the most straightforward manner. Numerical statistics such as Measures of central tendency and measures of dispersion should be included and results summarised in the most appropriate graphical form. Only one graph should be presented for the same data and should be visually clear and not over complex Tables, graphs etc should be clearly titles and labelled and units of measurements specified. Tables should be numbered and titled above the table, figures and graphs below, labels on axis should be unambiguous |
Research methods - The scientific process - Scientific reports |
|
|
Outline what inferential statistics are in the findings and result section of a scientific report |
Reasons for selecting a particular statistical test are given as well as what is tests for. The outcome of statistical analyses is given along with critical table values of the test. The significance level and whether the test was one tailed or two tailed. The outcome is explained in terms of acceptance and rejection of the experimental and null hypotheses. |
Research methods - The scientific process - Scientific reports |
|
|
What is a requirement of the discussion section of a Scientific report |
This section explains what the results mean and is broken down into subsections:
*Explanation of findings *Relationship to background research *Limitations and modifications *Implications and suggestions for future research |
Research methods - The scientific process - Scientific reports |
|
|
Outline the explanations of findings in the Discussion section of the scientific report. |
Key findings are described that relate to the aims and hypothesis. All findings should be presented, including minor ones, unexpected and contradictory ones, plus an explanation of what the findings show and why they occured. |
Research methods - The scientific process - Scientific reports |
|
|
Outline the relationship to background research in the Discussion section of the scientific report |
Research is presented and discussed in terms of previous research findings presented in the introduction. Aspects of the design that may account for differences in the findings from previous studies are outlined |
Research methods - The scientific process - Scientific reports |
|
|
Outline the limitations and modifications in the discussion section of the scientific report |
Possible sources of error, such as flawed measurement techniques, poor sampling etc. are outlined and discussed. Possible means of rectifying these faults are presented |
Research methods - The scientific process - Scientific reports |
|
|
Outline the implications and suggestions for future research |
further research studies suggested by the findings of the current ones are presented here. as well as other possible ways of tested the hypotheses. Also presented are any implications that findings of the present study suggest. Specific suggestions, like using more participants, eliminating confounding variables such as background environmental noise and improving standardised instructions, are find provided it is demonstrated that these factors have affected the findings in some way |
Research methods - The scientific process - Scientific reports |
|
|
Outline the requirements of a conclusion |
A concise paragraph is presented that summarises key conclusions drawn from the study |
Research methods - The scientific process - Scientific reports |
|
|
Outline the requirements of a reference |
Full details are listed of all references cited in the report. This enables others to research the references if deired. |
Research methods - The scientific process - Scientific reports |
|
|
Outline the requirements of appendicies |
Numbered appendicies are provided, containing full instructions given to subjects. raw data and calculations for statistical analyses, plus other stimulus materials used. Information should be presented clearly and unambiguiously. |
Research methods - The scientific process - Scientific reports |
|
|
Outline the role of peer review in the scientific process. |
This is scrutiny by experts of research papers to determine scientific validity This then determines if the findings can be published in scientific journals. The peer review system subjects scientific research papers to independent scrutiny. This acts as a gatekeeper or filter system, reducing the chances of flawed or unscientific research being accepted as fact. |
Research methods - The scientific process - Scientific reports |
|
|
Outline the peer review process |
Several expert reviewers to be sent copies of a researchers work by a journal editor. They highlight weaknesses or problem areas and suggestions for improvement. There are generally 4 options for reviewers to recomend: 2- accept as long as researcher improves in certain ways 3- reject but suggest revisions and a resubmission 4- reject outright |
Research methods - The scientific process - Scientific reports |
|
|
Outline what a single-blind review is in peer review |
This is the usual form of peer review. The names of reviewers aren't revealed to the researcher. The idea is that reviewer anonymity allowed for an unbiased review, free from interference by the researcher. However there is the danger that anonymous reviewers may delay the review process to allow them to publish similar research first and hide behind their anonymity to be undeservedly harsh |
Research methods - The scientific process - Scientific reports |
|
|
Outline what a double blind review is in peer review |
This involves both reviewers and the researcher being anonymous. The idea is that bias based on the researcher's ethnicity, age gender etc will not occur and that research will be peer reviewed fairly and not based upon the researchers fame. However it is likely that the researcher would be identifiable from the writing or research style. |
Research methods - The scientific process - Scientific reports |
|
|
Outline what an open review is in a peer review |
This is where reviewers and the researcher is known to eachother. This is seen as redcing the risk of personal comments and plagiarism and encourages open, honest peer reviewing. However, it may be that deserved criticism is watred down due to politness or fear of retribution from famous powerful researchers |
Research methods - The scientific process - Scientific reports |
|
|
Outline criticisms of peer review |
* peer review isn't unbiased - *in obscure research it may be impossible to find a person for peer review. *Funding by organisations may affect bias. *Some researchers have been accused of not accepting research so that their own studies can be published and of plagiarism. *The ability to publish papers is controlled by elites. Therefore there may be resistance to revolutionary ideas that go against the elite or prevailing views. *Peer review is a slow process *The consequences of false or unscientific research being accepted as true can be serious. EG Autism and vaccines relation. |
Research methods - The scientific process - Scientific reports |
|
|
Define quantitative data |
This is data that occurs in numerical form EG statistics , |
Research methods - Data handling and analysis |
|
|
Define Qualitative data |
Data that isn't numerical such as descriptions of events |
Research methods - Data handling and analysis |
|
|
Compare Quantitative and Qualitative data |
Qualitative data is *subjective *Imprecise *rich and detailed *low in reliability *used for attitudes, opinions and beliefs *Collected in IRL settings Quantitative data is: *Objective *precise *Lacks detail *High in reliability *used for behaviour *collected in an artificial setting |
Research methods - Data handling and analysis |
|
|
Define Primary data |
Data that is collected specifically towards a research aim, which has not been published before |
Research methods - Data handling and analysis |
|
|
Define secondary data |
Data originally collected towards another research aim which has been published before |
Research methods - Data handling and analysis |
|
|
Define a meta analysis |
A process in which a large number of studies , which have involved the same research question and methods of research question and methods of research are reviewed together, and the combined data is tested by statistical techniques to assess the effect size. |
Research methods - Data handling and analysis |
|
|
Outline and evaluate content analysis as a research method |
A method of quantifying qualitative data through the use of coding units and commonly performed with media research. + Ease of application + Compliments other methods +Reliable +Less unethical - Descriptive and not scientific -Flawed results - lack of causality |
Research methods - Data handling and analysis |
|
|
Define thematic analysis |
a method of qualitative research linked to content analysis, which involves analysing data to identify the patterns within it. |
Research methods - Data handling and analysis |
|
|
What are the 6 stages to thematic analysis |
1) Familiarisation with the data 2) Coding 3) Searching for themes 4) Reviewing themes 5) defining and naming themes 6) writing up. |
Research methods - Data handling and analysis |
|
|
Define Measures of central tendency |
Methods of estimating mid point scores in sets of data. This summarises large amounts of data - Theres the Mean Mode and Median |
Research methods - Data handling and analysis |
|
|
Outline and evaluate the median and how to calculate it |
This is the central score in a list of ranked ordered scores. with an odd number of scores the median is the middle score. in an Even number of scores the median is the mid point between the two middle scores. + Isn't affected by freak scores +easier to calculate + Media n can be used with ordinal data - Isn't as sensitive as the mean -can be unrepresentative in a small set of data |
Research methods - Data handling and analysis |
|
|
Outline and evaluate the mean and how to calculate it |
The mid point of a combined set of values of a set of data and is calculated by adding up all the scores and dividing by the total number of scores + Most accurate measure of central tendency + uses all the data in its calculation - Is less useful is some scores are skewed - the mean score may not be one of the actual scores in the set of data |
Research methods - Data handling and analysis |
|
|
Outline and evaluate the Mode and how it is calculated |
Most common/popular number in the scores +less prone to distortion by extreme values + it sometimes makes more sense than other measures. - there can be more than one mode in a set of data - doesn't use all the scores |
Research methods - Data handling and analysis |
|
|
Define Measures of dispersion |
Measurements of the spread of scores within a set of data This includes Range, Standard deviation, correlational data |
Research methods - Data handling and analysis |
|
|
Outline and evaluate the range and how its calculate |
The range is calcualted by subtracting the lowest value from the highest value in a linear set of data + It takes full account of extreme values - It can be distorted by freak values - IT doesn't show is data is clustered or spread around the meme |
Research methods - Data handling and analysis |
|
|
Outline and evaluate standard deviation and how its calculated |
Standard deviation is a measure of the variability of a set of scores from the mean. The larger the standard deviation the larger the spread of scores. 1) Calculate the mean 2) subtract the mean from each individual score 3) Square (^2) each of these scores 4) add all the squared scores together 5) divided the sum of the squares by the number of scores -1 (10-1 scores =9) (This is the variance) 6) use a calculator to work out the square rood of the variance. + Its a more sensitive dispertion measure than the range since all scores are used in its calculation +Allows for interpretation of individual scores - More complicated to calculate -less meaningful is data is not normally distributed |
Research methods - Data handling and analysis |
|
|
Outline and evaluate correlational data and how its calculated |
Provides data that can be expressed as a correlation coefficient. Which shows either a positive correlation, negative correlation or no correlation at all. The stronger a correlation the near it is to -1 or +1 . Its plotted on a scattergram which indicates the strength and direction of a correlation |
Research methods - Data handling and analysis |
|
|
outline the different types of presentation of Quantitative data |
Data can be presented through graphs, tables and charts. This helps to show the patterns in data. *Bar charts *Histograms *Frequency polygons *Pie Charts *Tables |
Research methods - Data handling and analysis |
|
|
Outline Bar charts |
They show data that is in the form of categories Categories are on the X axis (horizontal) The bars should be the same width and separated. Bar charts can show totals, means, percentages or ratios and can display two values together to look at different variables such as gender and age. |
Research methods - Data handling and analysis |
|
|
Outline a histogram |
This is similar to a bar chart but used for continuous data such as test score. There are no spaces between the bars since the data is continuous and the column width for each value should be the same width for each category interval |
Research methods - Data handling and analysis |
|
|
Outline a requency polygon / line graph |
This is similar to a histogram in that the data on the x-axis is continuous. The graph is produced by drawing a line from the mid point top of each bar in a histogram. The advantage is that two or more frequency distributions can be compared on the same graph such as gender differences |
Research methods - Data handling and analysis |
|
|
Outline a pie chart |
Pie charts are used to show the frequency of categories as percentages. The pie is split into sections, each one of which represents the frequency of a category. The sections are colour coded with an indication given of what each section represents and its percentage score |
Research methods - Data handling and analysis |
|
|
Outline tables
|
Results tables summarise the main findings of data and so differ from data tables which just present the raw unprocessed scores. It is customary with results tables to present data totals and relevant measures of dispersion and central tendency. |
Research methods - Data handling and analysis |
|
|
Define a normal distribution |
Data with an even distribution score on either side of them mean |
Research methods - Data handling and analysis |
|
|
Define a skewed distribution |
Data that does not have an even distribution of scores either side of the mean. This can be caused by outliers or 'freak scores' A positive skewed distribution is where there is a high extreme score. A negative skewed distribution is when there is a low extreme score. |
Research methods - Data handling and analysis |
|
|
Name the three ways in which data can be checked for its distribution |
*Examine visually *Calculate measures of central tendency (Mean mode and median) *Plot the frequency distribution (plot on a histogram) |
Research methods - Data handling and analysis |
|
|
Outline what a statistical test is |
A means of testing the significance of the results of a test. IT produces an observed value which is compared to a critical value in order to determine if the results are outside the boundaries of chance. |
Research methods - Data handling and analysis |
|
|
Outline what a sign test is |
This is a non parametiric statistical test. Used for experiments where data is "at least nominal" and a repeated measures design has been used. |
Research methods - Data handling and analysis |
|
|
What are the three key factors needed to determine what kind of statistical test is used? |
*What level of measurement is being used? (Nominal, ordinal or Interval) *Is it a test of difference or association (correlation) *If its a test of difference, is the design related or unrelated |
Research methods - Data handling and analysis |
|
|
Define nominal data |
Data that is categorised. an example is 'yes or no' answers. This information is crude and uninformative. |
Research methods - Data handling and analysis |
|
|
Define Ordinal data |
This is data that is 'ranked' such as from 1-10. like the 'pain scale' However, it is used when one doesn't know if the gap between say '3 and 4' is the same gap between '9-10' It can still work for ranked data where the gap is structured such as Cm's. if unsure if something is interval then you can state that it is "at least ordinal" because it is. |
Research methods - Data handling and analysis |
|
|
Define Interval data. |
Data that is standardised and ranked such as centermetres, temperaurs and distaces |
Research methods - Data handling and analysis |
|
|
Define inferential statistical testing |
These are statistical tests that make predictions about populations populations from mathematical analysis of data taken from samples.
|
Research methods - Data handling and analysis |
|
|
What is the acronym for remembering which statistical test should be used?
|
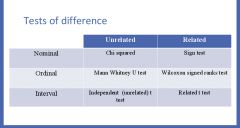
"cheese smells minging when it's red" Helps to remember the types of test used |
Research methods - Data handling and analysis |
|
|
When would one use a Chi Squared test?
|
When it is a measure of difference The data is Nominal and unrelated (independent groups) |
Research methods - Data handling and analysis |
|
|
When would one use a Sign test |
Measure of Difference The data is Nominal The data is Related (repeated measures design) |
Research methods - Data handling and analysis |
|
|
When would one use a Man Whittney U test? |
Measure of Difference Data is Ordinal The data is Unrelated (independent groups design) |
Research methods - Data handling and analysis |
|
|
When would one use a Wilcoxon signed ranks test |
Measure of difference Data is Ordinal The data is related (repeated measures design) |
Research methods - Data handling and analysis |
|
|
When would one use an independent T-test? |
Measure of difference Data is Interval The data is Unrelated / Independent (independent groups design) |
Research methods - Data handling and analysis |
|
|
When would one use a Related T test? |
Measure of difference Data is Interval The data is related ( Repeated measures) |
Research methods - Data handling and analysis |
|
|
How to remember tests of a correlation? |
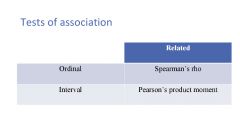
The statistical test for a correlation/ associated depends on the level of measurement. Ordinal is Spearman's Rho and Interval data is Pearson Product moment |
Research methods - Data handling and analysis |
|
|
What does "Cheese smells minging when its red" stand for? |
*Cheese - Chi Square *smells - Sign *minging - Man Whittney U *when - Wilcoxen *its - Independent T test *red - Related T test |
Research methods - Data handling and analysis |
|
|
Define probability in regards to statistical testing |
The likelihood of events being determined by chance. The degree of certainty that an observed difference or relationship between two sets of data is a real difference/relationship or whether the results are down to chance. Its impossible to have 100% probability, therefore nothing can be proven beyond all doubt. Therefore there needs to be a level of probability (p) |
Research methods - Data handling and analysis |
|
|
What level of significance do psychologists usually use against statistical testing? |
0.05 They are 95% sure that results are significant and not down to chance. This strikes the balance between type 1 and 2 errors. |
Research methods - Data handling and analysis |
|
|
Define a type I error |
When a difference/relationship in a data set is accepted as a real one but it is in fact not. They reject the Null hypothesis for the directional when they shouldn't have. This is because the level of significance is too lenient eg 0.10 (90%) |
Research methods - Data handling and analysis |
|
|
Define a type 2 error |
When a difference/relationship is wrongly accepted as being insignificant because the significant level is too strict (0.01/99%) The Null hypothesis is accepted and the directional one is rejected |
Research methods - Data handling and analysis |
|
|
What happens after the statistical test is done? |
The test will produce an observed value (number) This is compared to a critical value to see if the number is significant. This comparison needs to take into account: *If the hypothesis was directional or non directional *The Number of participants (N) *And the level of significance (0.05) |
Research methods - Data handling and analysis |
|
|
The only test we will need to work out is the SIGN test which uses a repeated measures design and nominal data.
|
*Participants (10) will be asked a nominal question (eg Apples or pairs?) *say, 1 participant likes Pears. 7 like apples and two like them equally. *The hypothesis was "people like apples more than pairs. *put a + or - or 'omitted' against all the answers depending on if they agree or disagree with the hypothesis. *calculate how many times the "-" sign occurs (eg 1) (1 now = S) *Find (N) which is the number of score with a + or - sign (8) *Is the hypothesis one or two tailed and the significance level of probability *The critical value can then be found on a table. If the results are less than the observed value then accept the null hypothesis. |
Research methods - Data handling and analysis |