Reading...
![]()
Play button
![]()
Play button
![]()
Use LEFT and RIGHT arrow keys to navigate between flashcards;
Use UP and DOWN arrow keys to flip the card;
H to show hint;
A reads text to speech;
55 Cards in this Set
- Front
- Back
|
Construction Industry Challenges
|
Clients not satisfied with products and processes delivered.
Workers and practitioners not satisfied with work environment. Low profitability and investment when compared to other industries |
|
|
Why are clients not satisfied?
|
a) High cost and duration of the project
b) Failure to meet cost and duration pre-set targets c) Failure of design to meet clients’ needs d) Quality of construction is poor (repairs and reworks) e) Inefficiency of the construction team to respond to clients’ complaints and enquiries f) Contractors not flexible enough to accommodate design changes g) Lack of innovation on behalf of the contractor and designer h) Disputes and claims i) Cost of occupancy and maintenance of building is high j) As built drawings and other information about the building and its requirements are incomplete. |
|
|
Why are workers not satisfied?
|
a) Bad working conditions (weather, facilities, etc)
b) Bad health and safety record (too many accidents, etc.) c) Low wages and salaries d) Job security e) People are not valued f) Frequently changing location of work g) Bad training and carrier development |
|
|
Causes of bad reputation
|
a) Lack of performance
b) Lack of innovation and development c) ‘Cowboy’ builders d) Industry dominated by the old craft culture and less technology e) Fragmented and adversarial. |
|
|
Causes of low profitability
|
a) High competition
b) Competitive tendering c) Client focus on cost rather than value d) Lack of investment in assets e) Inefficiency of industry and too much waste |
|
|
Lack of innovation and development leads to:
|
a) Lack of high technology in design and construction
b) Lack of branding c) Building products are behind in terms of value and intelligence d) High reliance on site based and unskilled labour e) Pace of development is slow f) Demand for buildings is largely client led (industry does little to create demand for new products). |
|
|
Current state of the industry
|
Design and construction are two separate processes.
Architect is the project leader. Competitive tendering is the most common Construction is dominated by the old craft culture (site based). The industry is fragmented and construction is performed by specialist subcontractors. Different projects are procured by different temporary teams. Project team responsibility ends at completion of construction. Client is not the consumer Need to price before production |
|
|
Henry Ford's contribution
|
Standardization
Assembly line production |
|
|
Modularity
|
Producing the output in modules or
subassemblies that are interchangeable, thus giving the consumer some choice. |
|
|
Five basic forms of transformation systems
|
1. Continuous process
2. Flow shops 3. Job shops 4. Project operations 5. Cellular shops. |
|
|
What is lean production
|
Created by Eiji Toyoda
Cutting waste. Waste is anything that does not add value to the final product (rework, non value-adding activities like inspection, stocks and inventories, labour sitting doing nothing, etc.). |
|
|
What does lean production involve (steps)?
|
1. Eliminate variations in the production process
2. Set up the infrastructure to accommodate variations should they occur (people and equipment) (cellular production) 3. Production system should drive design where possible (concurrent engineering) 4. Supply chain management and long term partnering 5. Getting it right first time (eliminate rework) 6. Continuous improvement or kaizen (emphasise on measurement). |
|
|
Two characteristics of construction (Ballard and Howell)
|
• It belongs in the category of ‘fixed position manufacturing’ (assembly has to be done on site)
• The product is rooted in place (standardisation is limited, customer is linked to the site, temporary teams) |
|
|
Two elements to make construction lean
|
Make the production of construction components lean and minimize site-based assembly.
Develop lean techniques for dynamic construction. |
|
|
Two aspects in all production systems (Koskela)
|
Conversion activities (value-adding):
While all activities expend cost and consume time, only conversion activities add value to the end product. Should be made more efficient (kaizen). Flow activities (non-value adding: inspection, waiting, moving): Through which the conversion activities are bound together. Should focus on reducing or eliminating them. |
|
|
Process mapping
|
The mapping exercise would entail identifying all of the activities associated with the process, their interrelationships and whether they add value to the end product or not.
Once a process is mapped, non value-adding activities (flow activities) would then be subject to reduction or elimination. |
|
|
Process standardization
|
A particular process is designed (or mapped),
documented and given out to the various participants to implement consistently and continuously. Helps reduce process variation. Two models in construction: RIBA, BPF Model |
|
|
Three ways to reduce project duration
|
1. Increase speed of tasks (increase resources, use of specialist subcontractors, better
technology, cut out non value-adding activities) 2. Overlap activities (fast track) (e.g design and construction) 3. Reduce the number of tasks (prefabrication and pre-assembly, combine activities). |
|
|
Reasons for allocating buffers (see Howell and Ballard 1994):
|
To compensate for differing average rates of supply and use between two activities. (e.g. bricklaying and plastering)
To compensate for uncertainty in actual rates of supply and use (inflow variation) (e.g. excavation and foundation) To allow differing work sequences by supplier and user activity. (e.g. columns and beams) |
|
|
Cost of buffers
|
Storing
Double handling Inventory management Loss (vandalism, deterioration, theft) Opportunity cost of idle cash Longer project duration Hard to size (overestimation) |
|
|
How to allocate buffers
|
Size of buffers should always limited to a minimum. (Reduce or eliminate inflow variation).
Buffers should be allocated between activities with different rates of production. Buffers should be allocated between activities with high inflow variation (uncertainty) |
|
|
'The Last Planner' features:
|
• It gives power to the last planner. This will ensure that work is selected in the right sequence. It will also ensure that the right amount of work is selected
• It provides a structure to planning (according to level of detail and size of window). The weekly plans (the last plans) are based on what can be done rather what should be done. This results in efficiency and less variability. The system encourages the application of PULL instead of PUSH strategies • The system emphasizes measurement of performance and continuous improvement. For example, the match between ‘will’ and ‘did’ is measured by Percent Plan Complete (PPC). |
|
|
Benefits of performance measurement
|
1. It provides the information needed to take business (strategic and operational) decisions
2. It provides the bases and incentives for continuous improvement 3. It provides the information needed to perform benchmarking. |
|
|
What do measurement frameworks involve?
|
Purpose of the measure
The measurement system The frequency of the measurement The re-evaluation of the measurement system |
|
|
Popular performance measurement frameworks/models
|
The performance measurement matrix
The performance pyramid The balanced scorecard (BSC) Brown's framework of process metrics The business Excellence Model (EFQM) |
|
|
The Balanced Scorecard (BSC)
|
Provides a balanced presentation of both financial and operational measures.
Quantifiable measures built around four perspectives: 1. Financial: investors’ views 2. Customer: the performance attributes valued by customers 3. Internal processes: the long and short-term means to achieve the financial and customer objectives 4. Learning and growth: capability to improve and create value It is primarily designed for mangers to gain an overall view of performance, and may be not apparent for all employees. Furthermore, it does not consider suppliers, which is particularly relevant in the construction industry. |
|
|
Performance Measurement Matrix
|

|
|
|
Results and Determinants Framework
|
Two basic types of performance measures:
1. Related to results: competitiveness finance 2. Focus on the determinants of the results: quality flexibility resource utilization innovation Results are lagging indicators, whereas determinants are leading indicators. |
|
|
Brown's Framework of Process Metrics
|
Deals with the horizontal flows of materials and information within the organisation, or the business processes.
Highlights the difference between input, process, output and outcome measures, and it encourages the checking of micro processes. • Input measures: quality and quantity of input e.g. the volume of flour quality of eggs etc. Process measures: cycle time and process parameters e.g. oven temperature, baking time etc. Output measures: monitors quality and dependability of output e.g. quality of the cake etc. Outcome measures: tracks the impact of the output e.g. the cake eaters etc. |
|
|
Performance Pyramid
|
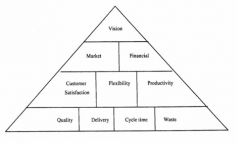
Ties together the hierarchical view of business performance measurement with the business process view.
It also makes explicit the difference between measures that are of interest to external parties (customer satisfaction, quality and delivery) and the primary internal interests of the business (productivity, cycle time, waste). However, some argue that this framework is difficult to operationalise. |
|
|
European Foundation for Quality Management's Model (EFQM)
|
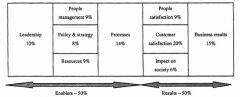
Two distinct subsets of performance factors:
1. Enablers (levers that management can pull to deliver future results) 2. Results However, the terms used in the framework are so open, and can be interpreted in so many ways, that a single organisation could decide to capture any of the several dozen different measures of performance under each of the headings. |
|
|
Key Performance Indicators (KPIs)
|
Launched by UK construction industry under its Construction Best Practice Programme (CBPP).
The indicators cover the following issues: • Client satisfaction: product • Client satisfaction: service • Defects • Predictability: cost • Predictability: Time • Profitability • Productivity • Safety • Construction cost • Construction time. |
|
|
CBPP's 'respect for people' indicators
|
Aim to examine stakeholder perspectives/culture on
the project. The indicators include: • Employee satisfaction • Staff turnover • Sickness absence • Safety • Investors in people • Working hours • Pay • Training • Diversity • Travelling time. |
|
|
Performance: What to Measure? (3 steps)
|
1. The first involves looking at strategy, defining the strategic objectives of the company or a process selected and determining how they are translated into divisional goals and individual management actions.
2. The second encompasses deriving an appropriate set of measures by populating a performance measurement matrix. 3. The third focuses on instilling the performance measurement system into management thinking. Critical here is closing the management loop and ensuring that the measurement system actually drives day-to-day decisions and actions, thereby ensuring the firm’s strategy is implemented. |
|
|
Performance measures should:
|
• Be continuously updated in accordance with organizational strategy
• Be as simple as possible • Be user friendly • Not be isolated (measurement systems should be integrated) • Be demanding (targets should be ambitious but achievable) |
|
|
Four Types of Benchmarking
|
1. Internal: where an organisation aims to identify improvement areas within its structure through comparing its business operations with those
of more successful companies. 2. Project/competitive: where an organisation assesses the performance of projects in which it is involved in and compares this with competitors in the same market that have competing products, services or work processes. 3. External/industry: where an organisation attempts to increase productivity through developing tools and techniques successfully used by other industries that are similar to that of their own. 4. Process/ generic: this focuses on the best work processes. Instead of directing the benchmarking to the business practices of a company, the similar procedures and functions are emphasised. Although this is thought to be extremely effective, it is difficult to implement and requires a broad conceptualization of the entire process and careful understanding of the procedures. |
|
|
The benchmarking process
|

|
|
|
Two main functions of building project management
|
1. The establishment of an appropriate organisational structure which allows a project to be managed by its objectives with respect to its technology, its contributors and the environment in which it takes place
2. The identification of the most appropriate project objectives having taken due cognisance of the project’s intended purpose, its client and its environment |
|
|
Sink's seven criteria for building project performance
|
ο Effectiveness - Quantitative - Process
ο Efficiency - Quantitative - Process ο Productivity - Quantitative - Process ο Profitability - Quantitative - Process ο Innovation - Qualitative - Process/Product ο Quality of Work Life - Qualitative - Process ο Quality of Product - Qualitative/Quantitative -Product However, interdependencies between these partial measures are not appraised. No single measure of true project performance is obtained. |
|
|
Oglesby's four criteria for 'on-site' building project performance
|
ο Productivity - Quantitative - Process
ο Safety - Qualitative/Quantitative - Process ο Timeliness - Quantitative - Process ο Quality - Qualitative/Quantitative - Product No single overall assessment of building project performance is obtained. |
|
|
Penderson and Walker's criteria for building project performance
|
ο Quality:-
(a) Technical Standards - Quantitative - Product (b) Aesthetic Standards - Qualitative - Product (c) Functional Standards - Quantitative/Qualitative - Product ο Price:- (a) Capital Cost - Quantitative - Product/Process (b) Running Costs - Quantitative - Product ο Time - Quantitative - Process Weighted in accordance with the relative importance attached to each by the Client organisation. It is possible to arrive at a single measure of building performance. However, validity problems when comparing alternative building policies or systems. |
|
|
Gardenes' criteria for building project performance
|
Combined performance measure is based upon
the partial performance measures of: ο Schedule ο Budget ο Value ο Productivity Requires the client to weight the importance of each partial performance measure and which requires that a set of baseline values for each partial measure be arbitrarily specified |
|
|
Project Management Tools
|
Tools used for options appraisal, such as the comparative benefit model, payback analysis, average rate of return, discounted cash flow, internal rate of return, profitability indices, scoring models.
Budgeting tools and systems such as the work breakdown structure (WBS), the planning and programming budgeting system (PPBS), Resource based cost estimating tools, activity/ task based estimating tools, Gozinto charts, learning curve analyses and risk analysis. Tools and systems designed to schedule tasks and thus to plan and control time include work study analysis, Gozinto charts, Gnatt Charts, the programme evaluation and review technique (PERT), the critical path method (CPM), the graphical evaluation and review technique (GERT) and computer analysis packages such as ‘Microsoft Project’, ‘Microplanner Expert’, ‘Pertmaster’, ‘Primavera’ and ‘SuperProject’ amongst others. |
|
|
Project Management Processes
|
Processes such as interface management (eg. TREND analysis and Linear Responsibility Analysis (LRA)) and knowledge management techniques are
designed to ensure that processes, tasks, information and personnel are coordinated and controlled such that the schedule and budget plans are realised. Advanced PERT and CPM procedures facilitate resource levellingand resource optimisation which enable time and cost tradeoffs such that a clients objectives may be realised efficiently and productively. Finally, processes and concepts such as total quality management (TQM), quality assurance (QA), value engineering (VE), zero defects and configuration management have as their intention the guarantee that product quality will be adequately delivered to the client organisation. |
|
|
Politics in PM refers to:
|
The positive actions of keeping peoples interest and motivation in a project and in insuring that the necessary support and resources are being provided to the project.
The project manager must be politically flexible between different projects. |
|
|
5 main sources of influence than can be used by project managers to gain project support
|
(i) Authority (properly commanding the influence and scope of control that has been given to the project manager)
(ii) Reward Power (direct and indirect) (iii) Punishment Power (best avoided or guarded against by wise project managers. This is because punishment scenarios tend to result in a strongly negative impact on the project) (iv) Expert Power (two types: specific technical knowledge, general management competencies) (v) Referent Power (aka project identification: contributors identify with the personality or other attribute of the project manager or the attractiveness of the project itself) |
|
|
5 categories to describe project parties
|
(i) Allies (high degree of mutual trust. important to keep allies ‘on-side’ and to fully involve them and communicate with them)
(ii) Opponents (there is trust. they disagree with the projects objectives, purpose or direction. these areas of disagreement and agreement should be clearly understood. Anticipating objections is also a necessary part of managing opponents) (iii) Bedfellows (low level of trust. continually work on the basis of the agreement that exists between them. guard against doing anything that would further degregate trust. they can be turned into an ally when the level of mutual trust is increased.) (iv) Fencesitters (confront them and ascertain exactly where they stand on particular project issues. least recommended approach: passive approach; rather assertiveness and willingness to confront is the key management requirement. (v) Adversaries (try to change one aspect of the project to accommodate objection without jeapordizing wider project objectives) |
|
|
4 concepts in managing superiors
|
(i) Visibility (show the good, reduce visibility of the bad until fix. never conceal unsolvable problems)
(ii) Priority (ensure priority of project in clients commitments) (iii) Accessibility (ensure client is accessible. avoid stakeholder power imbalance) (iv) Credibility ( the client must be able to trust the project managers ability, judgement and performance. openness and truthfulness) |
|
|
Partnering and its benefits
|
Establishment of medium- to- long term relationships between clients and their suppliers (principal contractors).
Benefits: Continuous improvement (main benefit) Cost and risk sharing (to deliver new technologies via R&D) Business needs become more closely aligned Cost savings (no failed tendering efforts. work with same individuals over a period of time) Increased trust (less adversarial disputes) |
|
|
Egan's 5 key drivers of change
|
1. Committed leadership,
2. A focus on the customer 3. Integrated processes and teams 4. A quality driven agenda 5. Commitment to people |
|
|
Partnering benefits examples
|
Example:
Marks and Spencer - Bovis Construction (lasted 20 years) Sainsbury's: achieved 20% cost reduction on a no. of projects Tesco Stores: reduced capital cost of their stores by 40% since 1991 and by 20% in last two years (of Egan report) Argent (commercial developer) reduced capital costs of its offices by 33% and total project time in some instances by 50% since 1991. The Whitbread Hotel Company rationalised its supply chain from 30 contractors to 5 and embarked on long-term partnership arrangements. whitbread shares its five year business plan with its partners. |
|
|
Standardization and Pre-Assembly example
|
Volumetric Ltd designs and manufactures prefabricated units which can be incorporated
in a variety of buildings. McDonald’s Restaurants have demonstrated an ability to construct a fully-functioning restaurant on site in 24 hours, using a very high degree of prefabrication and modularisation. The design allows expansion or even relocation. |
|
|
Benchmarking example
|
Taywood Engineering Ltd are using benchmarking in a project to identify a strategy for achieving zero defects in construction, including the principles
of a ‘zero defects culture’ and a range a possible tools, such as the concept of a ‘stop button’ in site production, to prevent defects “going down the line”. World-wide benchmarking studies of car and component manufacturing in the early 1990s revealed a two to one gap in performance and a 100 to one gap in quality between Japanese and Western car manufacturers. As a result of these improvements UK car production and exports have nearly doubled over the last decade. |
|
|
Partnering benefits example (Grocery Retailing)
|
Leading grocery producers and retailers established the Efficient Consumer Response (ECR) movement in the USA in 1993 to improve their competitiveness. The aim was to develop a common framework for jointly managing the grocery supply chain and to replace the advesarial relationships of the past.
In the last 15 years UK grocery retailers have made huge progress in streamlining their distribution systems, shrinking order lead times from two weeks to two days and cutting inventories from five to 2.5 weeks, at the same time as product ranges and volumes grew eight to ten fold. |
|
|
Replacing Contracts with Performance Measurement (Nissan example)
|
Nissan UK and Tallent Engineering Ltd have no formal contract beyond an annual negotiation of the cost and quality of the rear axles that Tallent produce for Nissan's cars, and rigorous targets for improving performance. If a problem was to occur with quality Tallent would send engineers to Nissan to fix it on the car production line. If a problem resulted in a significant loss of production, Nissan would expect to compensate Tallent for lost business or vice versa, but this has never happened.
Non-contractually based relationships between Nissan and its 130 principal suppliers: Competition is created across the supply chain by collating the performance information every month and informing each supplier of its performance in relation to the others. |