![]()
![]()
![]()
Use LEFT and RIGHT arrow keys to navigate between flashcards;
Use UP and DOWN arrow keys to flip the card;
H to show hint;
A reads text to speech;
33 Cards in this Set
- Front
- Back
|
What is the production function ? |
TP = f( L, Land, K, Enterprise ) |
|
|
L =? |
Number of workers/employees |
|
|
K =? |
Capital including plant and machinery |
|
|
What does the production function show? |
The relationship between the amounts of inputs used and the maximum amount of output generated. |
|
|
Inputs =? |
Factors of production |
|
|
Inputs / factors of production are.. |
Usually classified in 4 categories: Labor Land Capital Enterprise |
|
|
Short-run is? |
Period of time where there is at least one factor of production that cannot change. (Varies from industry. Eg food vs it market) |
|
|
Long-run is? |
A period of time when all the factors of production can be varied in quantity. |
|
|
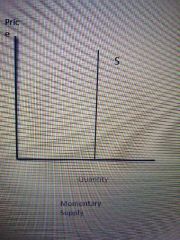
Momentary supply is? |
When the period of time is so short that the company does not have time to respond to price changes. The supply is then fixed because it is limited by the resources available. |
|
|
What is an example of momentary supply ? |
A bus full of tourists stop at a cafe one day and fill it beyond it's capacity. Table and food are limited. The number of meals that can be served from the cafe is perfectly inelastic. |
|
|
Example of a graph for momentary supply? |
|
|
|
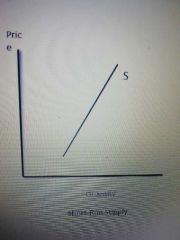
Example of short-run supply? |
Cafe owner is told that a new tour will be passing each summer so they. Buy extra chairs tables Hire more workers Increase food owners. Some inputs can be changed but some cannot. They're still limited by the cafe size. |
|
|
Example of short-run supply graph? |
|
|
|
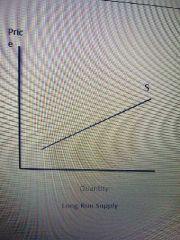
Example of long-run supply? |
Care owner applies for a loan to expand his cafe to adjust all inputs for the long run. |
|
|
Example of long-run supply graph? |
|
|
|
Example of production in the short-run table? |
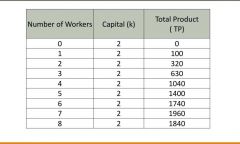
Two inputs K and L. The capital is fixed so change workers to maximize production |
|
|
Average product? |
Is to see how many products average each worker would make. L ÷ TP = AP |
|
|
What is marginal product? |
The chance in total product with each added worker so. AP - the AP previous / on top of that one. |
|
|
When production begins to decrease with each additional worker? |
We find out which worker creates the problem. Not necessarily their fault but lack of capital. (Magic buttons) / (computers) |
|
|
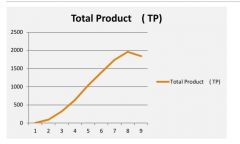
What does TP Total product curve look like? |
|
|
|
What does the TP Total product curve represent? |
The relationship between the variable input labor and output.(total product) Production levels change with each additional worker. Explained using the concept of marginal product and average product. |
|
|
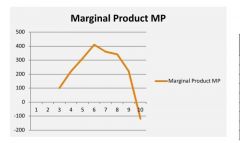
Marginal product curve? |
|
|
|
Definition of marginal product. |
The change in total output obtained from using an additional unit of a variable input, holding other inputs constant. |
|
|
Definition of average product |
The total product devided by the number of units of the variable input. |
|
|
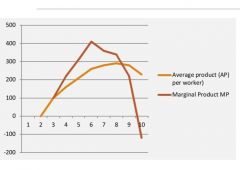
Graph comparing AP and MP |
|
|
|
The relationship between AP and MP.. eg. |
Average class height is 160cm. Mike joins and it is 161cm so we know his height "marginal" is above average. If the average was 159cm his height was below average. To stay the same get would have to be exactly 160cm. |
|
|
Why does the marginal product rise then fall? |
Production process Lack of machines Speicalising of labour (someone can come who specializes in that task so increase productivity besides fixed resources) Will not continue indefinitely Law of diminishing returns will take effect. |
|
|
What size the law of diminishing returns? |
Means that if at least one factor is fixed a point is reached where an additional unit of variable input adds less to total product than the previous unit. |
|
|
Increasing returns to scale (long run) |
The increase in output is proportionally greater than the increase in inputs for example if we double the amount of inputs the level of output will more then double. |
|
|
Constant returns to scale (long run) |
The increase in how sports matches the increase in imports for example if we double the amount of inputs the level of output will also doubled in means that changing the level of output over a range of production does not affect the average cost per unit. |
|
|
Decreasing returns to scale (long run) |
the increase in output is proportionately smaller than the increase in input for example if we double the amount of inputs the level of output will increase but less than a factor of 2 |
|
|
If MP is above AP |
Average is dragged up |
|
|
If the MP is below AP |
The average is dragged down. |