![]()
![]()
![]()
Use LEFT and RIGHT arrow keys to navigate between flashcards;
Use UP and DOWN arrow keys to flip the card;
H to show hint;
A reads text to speech;
38 Cards in this Set
- Front
- Back
|
population |
all the individuals that belong to the same species living in an area |
|
|
population density |
number of individuals in a certain area = population / area |
|
|
random distribution |
individuals randomly scattered throughout habitat trees in a forest are randomly distributed |
|
|
uniform distribution |
individuals spread equally throughout habitat territorial predators use this distribution |
|
|
clumped distribution |
large bunches of individuals are scattered throughout the habitat used to avoid predators |
|
|
intrinsic growth rate (aka biotic potential) |
the maximum possible rate of growth for a species |
|
|
Density Independent Factors |
factors which effect a population REGARDLESS OF THE SIZE OF THE POP ex: hurricane, fire, volcano, climate change |
|
|
Density Dependent Facotrs |
factors which effect populations DIFFERENTLY based ON THE SIZE OF THE POP ex: disease, predation, limiting nutrients, |
|
|
carrying capacity |
the maximum population an environment can sustain based on limited resources |
|
|
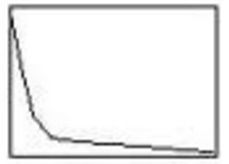
exponential growth model |
describes pops growing at exponential rate J-shaped Curve happens in populations at first, but only while they are not limited by disease / predation etc |
|
|
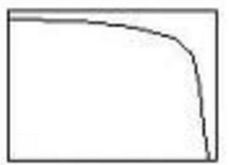
logistical growth model |
describes a population that grows exponentially at first, but slows at it approaches carrying capacity S curve |
|
|
K-selected species |
- Large - Reproductive maturity late in life - few large offspring - provide substantial parental care - populations grow slowly |
|
|
r-selected species |
- Small - Reproductive maturity early - Reproduce often - have lots of offspring - provide little or no parental care - populations grow quickly |
|
|
type 1 survivorship curve - K selected species - live long time and die in old age |
|
|
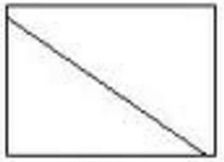
Type 2 survivorship curve -most living things |
|
|
Type III survivorship curve - r selected species - die quickly |
|
|
human population |
began growing after Neolithic revolution growing exponentially now, but begining to slow |
|
|
Crude Birth Rate (CBR) |
the number of births / 1000 individuals |
|
|
Crude Death Rate (CDR) |
number of deaths / 1000 individuals |
|
|
Population Growth Rate |
= (CBR - CDR) / 10 =% |
|
|
Doubling Time |
years it will take a pop to double = 70 / r |
|
|
Total Fertility Rate (TFR) |
average number of children a woman will have in her lifetime -higher in developing nations -lower in developed nations |
|
|
Replacement Level Fertility |
number of children needed to offset deaths and keep the population stable -higher in developing nations -lower in developed nations |
|
|
Life Expectancy |
average number of years that an average individual can be expected to live - longer in developed nations - shorter in developing nations |
|
|
Infant mortality |
number of children who die before their 1st birthday / 1000 births |
|
|
Child Mortality |
number of deaths under 5 per 1000 births |
|
|
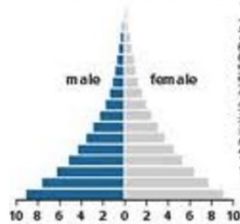
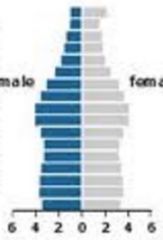
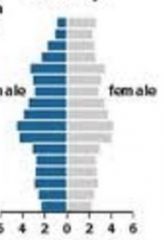
Age Structure Diagram |
aka population pyramid shows the relative size of different age groups in a population wide base = fast growing population narrow base = shrinking population column shaped = stable population |
|
|
fast growing population Stage 2 developing nation |
|
|
Stable population Stage 3 Developed nation |
|
|
Shrinking populaiton Stage 4 Developed Nation |
|
|
Theory of Demographic Transition |
states that the economic and social progress of the industrial revolution affects population growth in 4 stages |
|
|
Stage I |
Pre-Industrial Societies - agrarian - demand for children to work on farms - poor health care and sanitation lead to higher death rates and child mortality - high CBR and high CDR - small stable population |
|
|
Stage II |
Industrializing - improvements in health care and sanitation cause CDR to drop - cultural issues maintain high CBR - population grows rapidly Most environmental destruction |
|
|
Stage III |
Industrial Societies - CDR remains low b/c of medicine and sanitation -CBR drops for the first time for several reasons - women enter workforce and delay childbirth - women have control and access to birth control measures - no longer a demand for children as workers - cost of raising + educating a child rises Population growth stabalizes |
|
|
Stage IV |
Post Industrial Societies - CBR drops below CDR for the first time - population declines |
|
|
Problems from Rapid Population Growth |
Providing more resources for more people means: - habitat loss for farms, homes, mines, roads - increased energy use leading to NOx, SOx, and CO2 emissions - water pollution from lack of infrastructure -unemployment -lack of housing |
|
|
Problems from Declining Populations |
Smaller workforce More burden to provide social services for aging population |
|
|
ecological footprint |
measure of the amount of the Earth's surface needed to provide materials for your lifestyle US = highest developing nations = lowest |