Reading...
![]()
Play button
![]()
Play button
![]()
Use LEFT and RIGHT arrow keys to navigate between flashcards;
Use UP and DOWN arrow keys to flip the card;
H to show hint;
A reads text to speech;
13 Cards in this Set
- Front
- Back
|
*
Response Variable |
*
the variable whose value can be explained by the value of the EXPLANATORY variable |
|
|
*
Scatter Diagram |
*
a graph that shows the relationship between two quantitative variables measured on the same individual. Each individual in the data set is represented by a point in the scatter diagram. The explanatory variable is plotted on the horizontal axis, and the response variable is plotted on the vertical axis. |
|
|
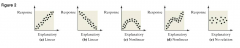
Positively and Negatively Associated Variables
|
If two variables are positively associated, then as one goes up the other also tends to go up. If two variables are negatively associated, then as one goes up the other tends to go down
|
|
|
Are scatter diagrams Linear Related?
|
|
|
|
*
Linear Correlation Coefficient (Def) |
*
A measure of the strength and direction of the linear relation between the two quantitative variables. It is always between -1 and 1, inclusive. The greek letter (r) represents the sample correlation coefficient |
|
|
*
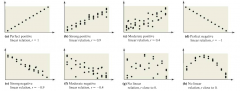
Linear Correlation Coefficient relationship (fig. 4 on pg. 181) |
|
|
|
r = 1
|
perfectly positive linear relationship
|
|
|
r = -1
|
perfectly negative linear relationship
|
|
|
Close to either 1 or -1 =
|
called a strong linear relationship in this situation
|
|
|
If r closer to 0 =
|
no linear relationship in this situation
|
|
|
Is r resistant?
|
No, are is not resistant = it is affected by extreme values
|
|
|
How to calculate r with Calc
|
1) enter explanatory variables for x in L1; enter response variables for y in L2
2.) Turn the diagnostics on by selecting the catalog (2nd 0). Scroll down and select DiagnosticsOn. Hit ENTER twice to activate diagnostics 3.) With the explanatory variable in L1 and the and the response variable in L2, press STAT, highlight CALC and select 4: LinReg (ax + b). With LinReg on the HOME screen, press ENTER r = linear correlation coefficient |
|
|
Central Tendency
|
1.) If data skewed left or right = median is best to use
2.) If data is symmetric = mean is best to use |