Reading...
![]()
Play button
![]()
Play button
![]()
Use LEFT and RIGHT arrow keys to navigate between flashcards;
Use UP and DOWN arrow keys to flip the card;
H to show hint;
A reads text to speech;
26 Cards in this Set
- Front
- Back
|
Define Mode.
|
The most commonly occurring value.
|
|
|
a) Define Median
b) How do you find middle value? |
a) The middle value when the data is in ascending/descending order
b) Add 1, divide by 2 |
|
|
Define range.
|
Difference between highest and lowest (highest minus lowest).
|
|
|
How do you do a tally chart?
|
>Do a column to show group labels, most probably class intervals, i.e. 50<60
>Do a second column to show the tally >Do a third column to show frequency (the number of tally's). |
|
|
Define class boundaries.
|
The precise values where you pass from one group into the next, i.e. 51<60, 61<70, class boundary = 60.5
|
|
|
Define mid-interval value.
|
The exact middle between intervals i.e. 51<60 = 55.5
|
|
|
What two points should you remember when plotting a cumulative frequency graph?
|
>Always plot points using the highest value from intervals of each group
>Cumulative Frequency is always plotted up the side |
|
|
How do you find the median on a cumulative frequency graph?
|
Exactly half way up the side then across, then down and read off value
|
|
|
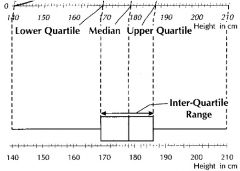
How do you find the lower and upper quartile on a cumulative frequency graph?
|
Exactly 1/4 and 3/4 up the side, then across, then down and read off value
|
|
|
How do you find the interquartile range on a cumulative frequency graph?
|
The distance on the bottom scale between the lower and upper quartiles.
|
|
|
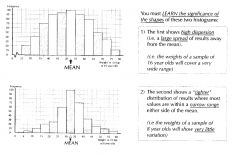
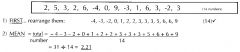
If a histogram is symmetrical what would you use for average?
|
Mean or median
|
|
|
What can you find from the middle of a histogram?
|
Mean
|
|
|
What do you always do with a frequency polygon?
|
Plot mid-points
|
|
|
What does a box plot look like?
|
|
|
|
How do you plot a histogram?
|
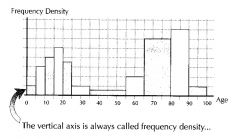
Add a column called frequency density which is frequency divided by the range of the interval. Its not height but area when drawing graph
|
|
|
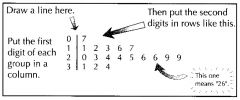
What does a stem and leaf look like?
|
|
|
|
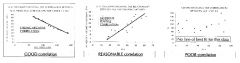
What does a scatter graph look like?
|
|
|
|
What does dispersion on a histogram mean?
|
|
|
|
Define Mean.
|
TOTAL of items / NUMBER of items
|
|
|
How do you do a frequency table?
|

Just multiply the two columns to make a third column titled, No x Frequency. If there's a tally column ignore it.
|
|

How do you find the mean using a frequency table?
|

Mean = 3rd Row Total / 2nd Row Total
|
|

How do you find the median using a frequency table?
|

Total of the frequency + 1 / 2, then starting with the first row frequency keep adding each frequency row until you get the number from the previous calculation, first column = median
|
|

How do you find the mode using a frequency table?
|

Mode = row with the highest frequency
|
|
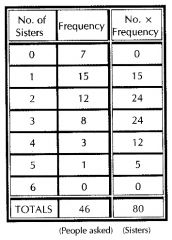
How do you find the range using a frequency table?
|

Difference between top row and bottom row of 1st column
|
|
|
How do you estimate the mean from grouped frequency tables?
|
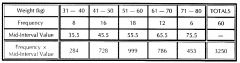
>Add a 3rd row consisting of mid-interval values
>Add a 4th row consisting of Frequency x Mid-Interval Value >Mean = Total of Freq x Mid-interval column / Total of Freq column |
|
|
How do you do cumulative frequency?
|
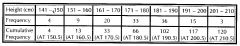
Add another column with a running total of the frequency.
|