![]()
![]()
![]()
Use LEFT and RIGHT arrow keys to navigate between flashcards;
Use UP and DOWN arrow keys to flip the card;
H to show hint;
A reads text to speech;
75 Cards in this Set
- Front
- Back
- 3rd side (hint)
|
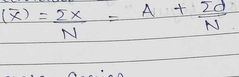
Mean (Individual Series) |
|
Average |
|
|
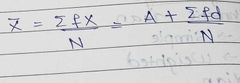
Discrete Mean |
|
|
|
|
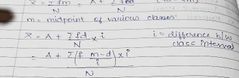
Continuous Mean |
|
|
|
|
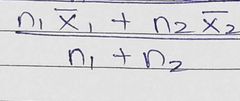
Combined Mean |
|
|
|
|
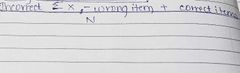
Correcting incorrect mean values |
|
|
|
|
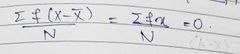
The sum of deviations of the items from AM [total X- Xbar] = |
0 because X bar is 'Point of Balance' |
|
|
|
The sum of squared deviations of the items from AM is [Total X- X bar] |
Minimum |
|
|
|
Median of individual series |
|
|
|
|
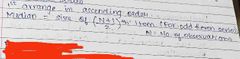
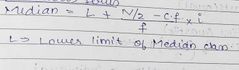
Median of Continuous series |
|
|
|
|
The sum of the deviations of the items from Median, ignoring signs is |
Least |
|
|
|
Extreme values do not affect ..... As strongly as they do affect ...... |
Median, Mean |
|
|
|
..... Refers to that value which occurs most often in the data |
Mode |
|
|
|
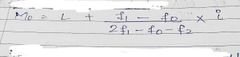
For continuous series mode is |
|
|
|
|
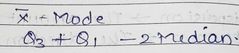
Mode = |
3 Median - 2 Mean |
|
|
|
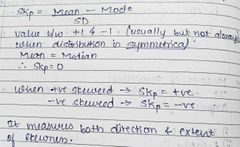
Symmetrical distribution |
Mean = Median = Mode |
|
|
|
Asymmetrical distribution (Positively skewed) |
Mean > Median > Mode |
Right tail hand side |
|
|
Asymmetrical distribution (Negatively skewed) |
Mean < Median < Mode |
Left tail hand side |
|
|
Relationship between AM, GM and HM |
AM > GM > HM |
|
|
|
Relationship between AM, GM and HM |
AM * HM = GM² |
|
|
|
X bar = |
(a + b) /2 |
|
|
|
GM |
√ab |
|
|
|
HM |
2ab/ a+b |
|
|
|
GM is most frequently used in the determination of .., |
Average percent of change |
|
|
|
....... Is the measure of the variation of items |
Dispersion |
|
|
|
....... Is scatter, spread or variation |
Dispersion |
|
|
|
Dispersion gives an average of the difference of various items from an average, they are called |
Average of 2nd order |
|
|
|
Variability |
Dispersion |
|
|
|
Dispersion are expressed in the same statistical unit in which the original data are given such as kg, rupees, tonnes, etc |
Absolute variation/dispersion |
|
|
|
Dispersion are expressed as ratio of a measure of absolute dispersion to an appropriate average |
Relative variation/dispersion which is also called as coefficient of Dispersion |
|
|
|
Range and quartile deviations are ........ measures because they depend on the values at a particular position in the distribution. |
Positional |
|
|
|
The average (mean, standard deviation) are called .......... because all of the values are employed in their calculations. |
Calculation |
|
|
|
Range |
Absolute measure L - S |
|
|
|
Coefficient of range |
Relative measure (L - S)/ (L + S) |
|
|
|
Quartile deviation |
(Q3 - Q1) / 2 |
|
|
|
Coefficient of quartile deviation |
(Q3 - Q1) / (Q3 + Q1) |
|
|
|
Average difference between the items in a distribution and the mean or median of that series |
Mean or average deviation |
|
|
|
There is an advantage in taking the deviation from Median because sum of deviations of items from Median is ....... when signs are ...... |
Minimum, Ignored |
|
|
|
Mean deviation= |

|
|
|
|
Coefficient of mean deviation |
|
|
|
|
Standard deviation |
Karl Pearson 1823 |
|
|
|
Standard deviation of individual series |

|
|
|
|
Variance |

(SD)² |
|
|
|
....... enables us to determine where the values of a frequency distribution are located. |
Standard Deviation |
|
|
|
Mean +- 1 sigma |
68.27% |
|
|
|
Mean +- 2 sigma |
95.45% |
|
|
|
Mean +- 3 sigma |
99.73% |
|
|
|
QD = |
2/3 sigma |
|
|
|
MD |
4/5 sigma |
|
|
|
Coefficient of variance is a ....... Measure of dispersion |
Relative |
|
|
|
..... Coefficient of Variation is preferred |
Less/ low as it is more consistent |
|
|
|
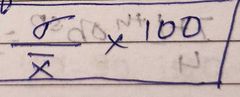
Coefficient of variance |
|
|
|
|
Skewness |
Direction of variation or extent of skewness |
|
|
|
Absolute skewness |
|
|
|
|
Karl Pearson's coefficient of skewness |
|
|
|
|
Bowleys coefficient of skewness |

|
|
|
|
Kelly's coefficient of skewness |

|
|
|
|
Arithmetic mean |
U1 (mew1) |
|
|
|
Variance |
U2 (mew2) |
|
|
|
Skewness |
U3 (mew3) |
|
|
|
Kurtosis |
Measures the peakedness or flatness of distribution |
|
|
|
Kurtosis |
U4 (mew 4) |
|
|
|
...... is a specific quantitative (statistical) measurement used to describe the various characteristics of a distribution |
Moments |
|
|
|
1st moment u1 |
|
|
|
|
2nd Moment U2 |

|
|
|
|
3rd Moment U3 |

|
|
|
|
4th Moment U4 |

|
|
|
|
Beta 1 B1 |

|
|
|
|
Beta 2 B2 |

|
|
|

Pink curve is? |
Leptokurtic |
|
|

Yellow curve is? |
Mesokurtic |
|
|
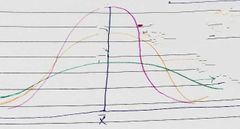
Green curve is? |
Platykurtic |
|
|
|
Mesokurtic |
Beta 2 = 3 Gamma 2 = 0 |
|
|
|
Leptokurtic |
Beta 2 > 3Gamma 2 > 0 |
|
|
|
Platykurtic |
Beta 2 < 3Gamma 2 < 0 |
|
|
|
Measure of kurtosis |
Gamma 2 = Beta 2 - 3 |
|