Reading...
![]()
Play button
![]()
Play button
![]()
Use LEFT and RIGHT arrow keys to navigate between flashcards;
Use UP and DOWN arrow keys to flip the card;
H to show hint;
A reads text to speech;
14 Cards in this Set
- Front
- Back
- 3rd side (hint)
|
Probability Distribution (of a discrete random variable)
|
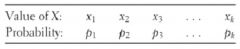
A list of probabilities associated with each of its possible values. The probabilities must satisfy the two requirements: Every probability is between 0 and 1 and the sum of the probabilities must equal 1.
|

|
|
|
Discrete Random Variable
|
A random variable, X, has a countable number of possible values.
|

|
|
|
Random Variable
|
A variable whose value is a numerical outcome of a random phenomenon
|
Example:
When tossing a coin and if X is the number of heads, than X is a random variable because its values vary when the coin tossing is repeated. |
|
|
Continuous Random Variable
|
A variable that takes all values in an interval of numbers. Its probability distribution can be described with a density curve. Probability for a certain interval can be found by taking the area of the space between two values in its density curve. The probability of an individual outcome is 0.
|
Example:
When observing the amount of rain falling in a city and X is rain in inches, X is a continuous random variable because there are infinite numbers of values. |
|
|
Normal Distribution
|
One type of continuous distribution. The normal distribution has a mean of 0 and standard deviation of 1.
|
The bell curve histogram.
|
|
|
Mean of Any Discrete Random Variable
|
It is an average of the possible outcomes but a weighted average in which each outcome is weighted by its probability.
|
Payoff x: $0 $500
Probability: 0.999 0.001 $500(0.001) + $0(,999) = $0.50. |
|
|
Variance
|

|

For the set 4, 2, 5, 8, 6, we calculate the mean to be 5.
Then the sum of (x-mean)^2=20 so variance=20/5=4 |
|
|
Standard Deviation
|
√Variance
|
See Variance.
If variance is 4, standard deviation is √4=2 |
|
|
Standardized Variable (Z-Score)
|

|
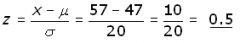
Example calculation.
|
|
|
Sampling Distribution
|
The probability distribution of random variables
|

|
|
|
Law of Large Numbers
|
In the long run, the proportion of outcomes taking any value gets close to the probability of the value. The average outcome gets close to the distribution mean.
|

|
|
|
Law of Small Numbers
|
The incorrect assumption that short sequences of random events will show the kind of average behavior that occurs only in the long run.
|

RandInt(0,100,2)
this will not give us an accurate average of what will happen in the long run |
|
|
Rule for Means
|
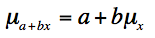
Rule 1:
|

Rule 2:
|
|
|
Rule for Variances
|
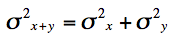
Rule 1:
|

Rule 2:
|