![]()
![]()
![]()
Use LEFT and RIGHT arrow keys to navigate between flashcards;
Use UP and DOWN arrow keys to flip the card;
H to show hint;
A reads text to speech;
133 Cards in this Set
- Front
- Back
- 3rd side (hint)
|
What is CVDOT? |
1. Center 2. Variation 3. Distribution 4. Outliers 5. Time |
What are the important characterizations of data? |
|
|
What is the Center of data? |

|
What does the middle of a data set indicate? |
|
|
What is Variation? |

|
|
|
|
What is Distribution? |

|
Bell-shaped, left-skewed, right-skewed, bimodal and uniform.... |
|
|
What are Outliers? |

|
Real oddities |
|
|
Why create a frequency distribution/table? |

|
What would be the best help in making sense of a data set? |
|
|
What are lower/upper class limits? |

|
Just managing to qualify for the class |
|
|
What is a Class Midpoint? |

|
How do you find the exact center between two close numbers? |
|
|
What is a Class Width? |
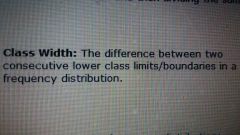
|
How do you measure the difference between lower class limits? |
|
|
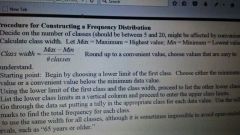
How do you construct a Frequency Distribution? |

|
How do you build a perfect representation of a data set? |
|
|
What else should you keep in mind about a frequency distribution? |

|
|
|
|
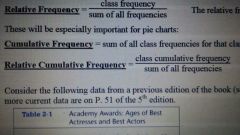
What makes a Relative Frequency Distribution? |

|
What is a Relative Frequency? |
|
|
How do you compute the relative frequency for a class? |

|
|
|
|
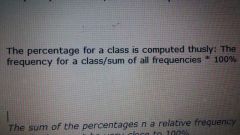
How do you compute the percentage for a class? |
|
|
|
|
What should be kept in mind for a Relative Frequency Distribution? |

|
|
|
|
What is a Cumulative Frequency Distribution? |

"Cumulative" |
|
|
|
What are the characteristics of a normal/bell-shaped distribution? |

|
|
|
|
What is a Histogram? |

|
What would a frequency distribution look like in graphic form? |
|
|
What is a Relative Frequency Histogram? |

|
What would make this sort of histogram special? |
|
|
What is a Frequency Polygon? |

|
So shapely, so.... Pointy |
|
|
What is a Relative Frequency Polygon? |

|
What would make a Relative Frequency Polygon different from a normal polygon? |
|
|
What's an Ogive? |

|
Like a duster, all this graph's line does is grow as it accumulates more and more |
|
|
What's a Dotplot? |

|
Less dots and more like stacks of dots |
|
|
What's a Stemplot depict? |

|
|
|
|
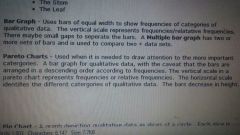
What's a Bar Graph depict? |

|
|
|
|
What's a Pareto Chart? |
|
Like if someone with OCD was in charge of a bar graph |
|
|
What's a Pie Chart? |

|
|
|
|
What's a Scatter plot/Scatter diagram? |

|
|
|
|
What's a Time-Series Graph? |

|
|
|
|
What are aspects of a bad graph? |

|
|
|
|
How do you construct a Frequency Distribution? |

|
|
|
|
How do you find a Class' Boundary? |

|
|
|
|
How to calculate Class Width |

|
|
|
|
How to understand Normal Distribution? |

|
|
|
|
What's the difference between descriptive and inferential statistics? |

|
|
|
|
Relative Frequencies... |

|
|
|
|
What's important about a Linear Correlation Coefficient? |

|
|
|
|
What are the principles to keep in mind for graphs? |

|
|
|
|
What is E w/ Sharp Pointy Edges |
Summation |
All together, now |
|
|
What is a Voluntary Response Sample? |

|
|
|
|
What are data? |

|
|
|
|
What is Statistics? |

|
|
|
|
What is a Census? |

|
|
|
|
What's a Sample? |

|
|
|
|
What are the Steps of Statistical. Thinking? |

|
|
|
|
What's a Parameter? |

|
|
|
|
What's a Statistic? |

|
|
|
|
What are Qualitative Data? |

|
|
|
|
What are Categorical Data? |

|
|
|
|
What are Discrete Data? |

|
|
|
|
What are Continuous Data? |

|
|
|
|
What is the Nominal Level of Measurement? |

|
|
|
|
What's the Interval Level of Measurement? |

|
|
|
|
What's the Ratio Level of Measurement? |

|
|
|
|
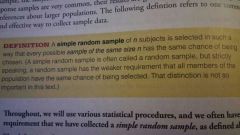
What's a Simple Random Sample? |

|
|
|
|
What's a Lurking Variable? |

|
|
|
|
What are the Sampling Methods? |

|
|
|
|
What are the Different Methods of Observation? |

|
|
|
|
What are the Methods of Controlling the Effects of Different Variables? |

|
|
|
|
What are the Different Errors? |

|
|
|
|
What are the Different Methods of Conversion? |

|
|
|
|
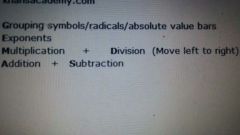
Order of Operations |
|
|
|
|
What are Descriptive Statistics? |

|
|
|
|
What are Inferential Statistics? |

|
|
|
|
What's a Mean? |

|
|
|
|
What are the Different Kinds of Mean? |

|
|
|
|
What's the Median? |

|
|
|
|
What's the Mode? |

|
|
|
|
What's the Midrange? |

|
|
|
|
What's the Round-off Rule? |

|
|
|
|
How do you get the mean from a frequency distribution? |

|
|
|
|
How do you Compute the Weighted Mean? |

|
|
|
|
How do you Compute Range? |

|
|
|
|
What's Variance? |

|
|
|
|
What are the Different firms of Variance? |

|
|
|
|
Things to Keep in Mind about Variance |

|
|
|
|
Chebyshev's Theorem |

|
|
|
|
How do You Calculate Class Width? |
|
|
|
|
How do you calculate Relative Frequency? |

|
|
|
|
How do you calculate Relative Cumulative Frequency? |
|
|
|
|
What Differentiates a Dot Plot from a Line Plot? |

|
|
|
|
What's a Stem-and-Leaf Plot? |

|
|
|
|
What are the Usual Value Formulas? |
Minimum Usual Value = mean - 2(mu) Maximum Usual Value = Mean + 2(mu) |
|
|
|
The Difference Between Relative Frequency and a Percentage Frequency Distribution? |

|
|
|
|
What is the formula for calculating Sample Standard Deviation? |

|
|
|
|
What's a Population Standard Deviation? |

|
|
|
|
Notation |

|
|
|
|
The Three Classes of Categorical |

|
|
|
|
The Two Different Classes of Data |

|
|
|
|
The Nominal Level of Measurement |

|
|
|
|
The Ordinal Level of Measurement |

|
|
|
|
The Interval Level of Measurement |

|
|
|
|
The Ratio Level of Measurement |

|
|
|
|
The Levels of Measurement |

|
|
|
|
What's a Simple Random Sample? |
|
|
|
|
Random or Simple Random Sample? |

|
|
|
|
What's Systematic Sampling? |

|
|
|
|
What's Stratified Sampling? |

|
|
|
|
What's Cluster Sampling? |

|
|
|
|
What are the Types of a Studies? |

|
|
|
|
What's an Example of a Bad Experimental Design? |

|
|
|
|
What's a Completely a Randomized Experimental Design? |

|
|
|
|
What's a Randomized Block Design? |

|
|
|
|
What's a Matched Pair Design? |

|
|
|
|
What are the Different Sampling Errors? |

|
|
|
|
How do you Create a Relative Frequency for a Class? |

|
|
|
|
How do you Create a Percentage for a Class? |

|
|
|
|
What's the Golden Rule of Relative Frequency Distributions? |

|
|
|
|
What are the Important Components of a Normal Distribution? |

|
|
|
|
What's a Histogram? |

|
|
|
|
What's a Relative Frequency Histogram? |

|
|
|
|
What are the Four Distributions? |

|
|
|
|
What's a Scatter Plot? |

|
|
|
|
What's a Time-Series Graph? |

|
|
|
|
What's a Dot Plot? |

|
|
|
|
What's a Stemplot? |

|
|
|
|
What's a Bar Graph? |

|
|
|
|
What's a Pareto Chart? |

|
|
|
|
What's a Pie Chart? |

|
|
|
|
What's a Frequency Polygon? |

|
|
|
|
What's an Ogive? |

|
|
|
|
What are the Crucial Properties of a Mean? |

|
|
|
|
What is the Round-off Rule? |

|
|
|
|
What is the Round-off Rule? |

|
|
|
|
What's the Standard Deviation? |

|
|
|
|
What's Variance? |

|
|
|
|
Variance Notation |

|
|
|
|
What are the Properties of Variance? |

|
|
|
|
What is the Empirical Rule? |

|
|
|
|
A Visual Representation of the Empirical Rule? |

|
|
|
|
What is Chebyshev's Theorem? |

|
|
|
|
What is the Round-off Rule fur the Coefficient of Variation? |

|
|
|
|
Frequency |
Percentage |
|