![]()
![]()
![]()
Use LEFT and RIGHT arrow keys to navigate between flashcards;
Use UP and DOWN arrow keys to flip the card;
H to show hint;
A reads text to speech;
56 Cards in this Set
- Front
- Back
|
What is Science? |
An intellectual activity, encompassing observation, description, experimentation, and explanation of natural phenomena. |
|
|
What do scientists do? |
Are curious, ask questions about how the world works, seek answers |
|
|
What is the scientific method? |
Step 1: Make observations, Step 2: formulate a hypothesis, Step 3: Devise a testable prediction, Step 4: Conduct a critical experiment, Step 5: Draw conclusions and make revisions. |
|
|
Why is the scientific method a particularly effective approach? |
Because it is empirical, rational, testable, repeatable, and self-correcting |
|
|
The scientific method is a ________, _________, and _________ pathway to understanding the world. |
Flexible, adaptable, efficient |
|
|
An example of an observation is: |
To many people, consuming echinacea extract seems to reduce the intensity or duration of symptoms of the common cold. |
|
|
A hypothesis must what? |
Clearly establish mutually exclusive alternative explanations for a phenomenon, and generated testable predictions. |
|
|
An example of a hypothesis is: |
Echinacea reduces the duration and severoty of the common cold. |
|
|
What is a null hypothesis? |
A negative statement that proposes that there is no relationship between two factors. |
|
|
Is the hypothesis or null hypothesis more valid? |
They are equally valid but the null hypothesis is easier to prove. |
|
|
Why is a null hypothesis easier to prove? |
Because a single piece of evidence that contradicts a null hypothesis is sufficient for rejection. |
|
|
The goal for devising a testable prediction from a hypothesis is to? |
Propose a situation that will give a particular outcome if your hypothesis is true, but that will give a different outcome if your hypothesis is not true. |
|
|
What is an example of devising a testable prediction? |
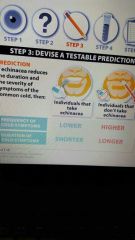
If echinacea reduces the furation and severity of syntoms of the common cold, then: |
|
|
What does a critical expierement do? |
One that makes it possible to decisively determine whether a particular hypothesis is correct. |
|
|
What is an example of conducting a critical experiment? |

Researchers randomly divided 437 volunteers into four groups to test the effect of echinacea on the common cold. |
|
|
What can we do with the results of experimental tests? |
We can revise a hypothesis and explain the observable world with increasing accuracy. |
|
|
What do experimental conclusions often generate? |
Ideas for further experimentation. |
|
|
What is an example of drawing conclusions and making revisions? |

|
|
|
When do hypotheses become theories? |
A hypothesis is a proposed explanation for phenomenon, a theory is a hypothesis for natural phenomena that is exceptionally well supported by the data. |
|
|
What makes a hypothesis? |
A good hypothesis leads to good predictions. |
|
|
What makes a good theory? |
Repeatedly tested and broader in scope. |
|
|
What are the 4 elements common to most experiments? |
1. Treatment, 2. Experimental Group, 3. Control Group, 4. Variables |
|
|
What is a treatment? |
Any experimental condition applied to individuals. |
|
|
What is an experimental group? |
A group of individuals who are exposed to a particular treatment. |
|
|
What is a control group? |
A group of individuals who are treated identically to the experimental group with the one exception: they are not exposed to treatment. |
|
|
What is a variable? |
Characteristics of your experimental system that are subject to change. |
|
|
What does controlling variables in an experiment do? |
The most important feature of a good experiment, the attempt to minimize any differences between a control group and an experimental group other than the treatment itself, Randomized (the subjects are randomly assigned into experimental and control groups. ) |
|
|
What happens without a controlled group? |

|
|
|
What is a blind experimental design? |
The experimental subjects do not know which treatment (if any) they are recieveing. |
|
|
What is a double-blind experimental design? |
Neither experimental subjects nor the experimenter knows which treatment the subject is receiving. |
|
|
What should vary only with respect to the treatment interest? |
Control and experimental groups |
|
|
How do you draw in clear conclusions? |
Hold constant all those variables we are not interested in. |
|
|
What must an experiment have before it is widely accepted? |
Experiments and their outcomes must be repeatable for their conclusions to be valid. |
|
|
What can influence behavior, including our collection and interpretation of data? |
Biases |
|
|
Is it possible to minimize such biases? |
With careful controls |
|
|
How can we better understand and explain phenomena? |
With visual displays of data. |
|
|
What are the three common displays of data used in biology? |
Bar graph, line graph, pie chart |
|
|
What is a bar graph? |
Rectungular bars are used to represent data, each with a height that is proportional to the value being presented. |
|
|
What is a line graph? |
A line or curve may be used to connect data points or to illustrate trends across many data points. |
|
|
What is a pie chart? |
"Slices" are used to represent data, in which each slice is a proportion of the whole. |
|
|
What are the 2 variables used in biology? |
Independent and dependent variables?? |
|
|
What is an independent variable? |
Some measurable entity that is available at the start of a process and whose value can be changed as required. |
|
|
What is a dependent variable? |
Created by the process being observed and value cannot be controlled. |
|
|
What are the 6 things usualy displayed on a graph? |
Title, y-axis, Dependent variable, Data points, x-axis, independent variable |
|
|
What can using displays in a presentation reduce? |
Ambiguity, biases, hidden assumptions, and other issues that reduce a viewers confidence in the underlying truth of the presented phenomena. |
|
|
What can statistics help with? |
Evaluating wether differences between a treatment and control group can be attributed to the treatment rather than random chance. |
|
|
What are statistics? |
A set of analytical and mathematical tools designed to help researchers gain understanding from the data they gather. |
|
|
Drawing conclusions based on observations is _____. |
Risky |
|
|
What does a positive correlation mean? |
When one variable increases, so does the other. |
|
|
What can stastics help us identify? |
Relationships (or lack of relationships ) between variables. |
|
|
What does Paeudoscience and anecdotal observations often lead people to believe? |
That links between two phenomena exist, when in fact there are no such links. |
|
|
What is pseudoscience? |
Individuals make scientific sounding claims that are not supported by trustworthy, methodical scientific studies. |
|
|
What is an ancedotal observation? |
Based on one or a few observations, people conclude that there is (or is not) a link between two things. |
|
|
Are there limits to what science can do? |
Yes. |
|
|
Is life easily described? |
No |
|
|
What are characteristics that all living organisms share? |
Complex and ordered organization, they use and transform of energy, responsiveness to the external enviornment, regulation and homeostasis, growth, development, and reproduction, evolutionary adaptation leading to decent with modification. |