![]()
![]()
![]()
Use LEFT and RIGHT arrow keys to navigate between flashcards;
Use UP and DOWN arrow keys to flip the card;
H to show hint;
A reads text to speech;
71 Cards in this Set
- Front
- Back
|
Frequencies |
Number of observations falling into each category of a variable |
|
|
Proportions |
A relative frequency obtained by dividing the frequency in each category of a variable by the total number of cases |
|
|
Percentages |
A relative frequency obtained by dividing the frequency in each category of a variable by the total number of cases and multiplying by 100 |
|
|
Bivariate Analysis |
A statistical method designed to detect and describe the relationship between 2 variables |
|
|
Cross-tabulation |
•A technique for analyzing the relationship between 2 variables that have been organized in a table (also known as crosstab or contingency table) •Can be used with any LoM but is most often used with nominal and ordinal variables |
|
|
Bivariate Table |
A table that displays the distribution of one variable across the categories of another variable |
|
|
Column Variable of Bivariate Table |
A variable whose categories are the columns of a bivariate table, usually the independent variable |
|
|
Row Variable |
A variable whose categories are the rows of a bivariate table, usually the dependent variable |
|
|
Cell |
The intersection of a row and a column in a bivariate table |
|
|
Marginals |
The row and column totals in a bivariate table |
|
|
Column Percentages |
(# in cell/Column totals as base)*100 |
|
|
Row percentages |
(#in cell/ Row totals as base)*100 |
|
|
Properties of a Bivariate Table |
1. Does there appear to be a relationship? 2. How strong is the relationship? 3. What is the direction of the relationship? |
|
|
The larger the difference across categories of the independent variable |
The stronger the association |
|
|
Positive relationship |
A bivariate relationship measured at the ordinal level or higher in which the variables varies in the same direction |
|
|
Negative Relationship |
A bivariate relationship measured at the ordinal level or higher in which the variables vary in opposite directions |
|
|
Elaboration |
A process designed to further explore a bivariate relationship and uses the introduction of control variables |
|
|
3 goals of elaboration |
1. Allow us to test for non-spuriousness 2. Clarifies the causal sequence of bivariate relationship by introducing variables hypothesized the intervene between IV and DV 3. Specifies the different conditions under which the original bivariate relationship might hold |
|
|
Direct Causal Relationship |
A bivariate relationship that cannot be accounted for by other theoretically relevant variables |
|
|
Spurious Relationship |
A relationship in which both the IV and DV are both influenced by a causally prior control variable and there is no causal link between them |
|
|
Partial Tables |
Bivariate tables that display the relationship between the IV and DV while controlling for a 3rd variable |
|
|
Partial Relationship |
The relationship between the IV and DV shown in a partial table |
|
|
The Process of Elaboration |
1. Divide the observations into subgroups on the basis of the control variable (have as many subgroups as there are categories in the control variable) 2. Re-examine the relationship between the original 2 variables separately for the control variable subgroups 3. Compare the partial relationships with the original bivariate relationship for the total group |
|
|
Intervening relationship |
A relationship in which the control variable intervenes between the IV and DV |
|
|
Intervening Variable |
A control variable that follows an IV but precedes the DV in a causal sequence |
|
|
Conditional Relationship |
A relationship in which the control variable's effect on the DV is conditional on its interaction with the IV |
|
|
ANOVA |
•An inferential statistics technique designed to test for significant relationship between 2 variables in 3 or more samples •Examines the differences between samples and within a single sample •Avoids Type I inflation |
|
|
One-Way ANOVA |
An analysis of variance procedure using 1 IV and 1 DV |
|
|
Assumptions for ANOVA |
1. Random 2. Independent 3. DV is interval ratio and with caution ordinal 4. Normal distribution 5. Population variances are equal 6. IV is nominal or ordinal |
|
|
Null hypothesis for ANOVA |
M1=M2=M3 "No difference" |
|
|
Research Hypothesis for ANOVA |
At least one mean is different |
|
|
Mean Square Within |
An estimate of the within-group variance obtained by dividing the within-group sum of squares by its degrees of freedom |
|
|
The F-Statistic |
The ratio of between-group variance to within-group variance (difference on top and error on the bottom) |
|
|
F Ratio (F Statistic) |
Used in an analysis of variance and represents the ratio of between group variance to within group variance |
|
|
F obtained |
Computed by the ratio for between group to within group variance (p value) |
|
|
F critical |
The F score associated with a particular alpha level and degrees of freedom and marks the beginning of the region of rejection for H0 (alpha value) |
|
|
5 steps for hypothesis testing |
1. Making assumptions 2. State H1 and H0 and slect alpha 3. Select the sampling distribution and specifying the test stat 4. Computing the test stat 5. Make a decision and interpret |
|
|
Descriptive Statistics |
•Can be used to describe the group (sample or population) that is being studied •Apply only to the cases being studied |
|
|
Inferential Statistics |
•To make predictions or inferences about a pop from observations and analyses of a sample •Are used to generalize to a larger group from which the sample was drawn |
|
|
The Chi-square Test |
•An inferential statistical technique designed to test for significant relationships between 2 nominal or ordinal variables organized in a bivariate table •Requires no assumptions about the shape of the pop distribution from which a sample is drawn •Is a "goodness of fit" test that assesses the degree to which the observed frequency distribution matches a theoretical frequency distribution |
|
|
Statistical independence |
•When 2 variables are not associated or related they can be said to be "statistically independent" of one another •The percentage distributions of the DV between each category of the IV are identical |
|
|
Expected Frequencies |
The cell frequencies that would be expected in a bivariate table if the 2 variables were statistically independent (ie would be by chance alone) |
|
|
Observed frequencies |
The cell frequencies actually observed in a bivariate table |
|
|
The Chi-square Distribution |
•Positively skewed so H1 is always a one-tailed test •Values are always positive (min is 0 with no max) •As the degrees of freedom increase, the distribution becomes more symmetrical |
|
|
Chi-Square Test Limitations |
1. Does not offer much info about the strength of the relationship or its substantive significance in the pop (can only say there's a relationship, not in what way) 2. Sensitive to sample size 3. Sensitive to small expected frequencies in one or more of the cells in the table |
|
|
Assumptions of Chi Square |
•Requires no assumptions about the shape of the pop distribution •Random sampling but is often used with non-Random samples •Can be applied to variables at a nominal and/or an ordinal LoM •Requires a min frequency of 5 cases per cell |
|
|
Research Hypothesis for Chi-square |
The 2 variables are related |
|
|
Null hypothesis for Chi-square |
No relationship between the 2 variables and so are statistically independent |
|
|
Chi-Square (Obtained) |
The test stat that summarized the differences between the observed and the expected frequencies in a bivariate table |
|
|
Measure of Association |
•A single summarizing number that reflects the strength of a relationship, indicates the usefulness of predicting the DV from the IV, and often shows the direction of the relationship •Based on proportional reduction of error |
|
|
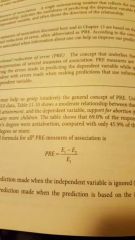
Proportional Reduction of Error |
•The concept that underlies the definition and interpretation of several measures of association •PRE measures are derived by comparing the errors made in predicting the DV while ignoring the IV with errors made when making predictions that use info about the IV •Can range from 0 to +/- 1 •The more the measure of association departs from 0, the stronger the association |
|
|
Lambda |
•An assymetrical measure of association that is suitable with nominal variables •Can range from 0 to 1 •Provides us with an indication of the strength of an association between the IV and DV |
|
|
Assymetrical measure of association |
A measure whose value may vary depending on which variable is considered the IV and the DV |
|
|
Cramer's C |
•Based on the value of Chi-Square and ranges between 0 and 1 (0- no association 1- perfect association) •Can't take on negative values so is non-directional |
|
|
Symmetrical Measures of Association |
A measure whose value will be the same when either variable is considered the IV or the DV |
|
|
Gamma |
•Suitable for use with ordinal variables or with dichotomous/nominal variables •Can vary from 0 to +/- and provides us with an indication of the strength and direction of the association between the variables |
|
|
Kendall's Tau-B |
•Suitable for used with ordinal variables •Can vary from 0 to +/- 1 (provides an indication of strength and direction of association) •Will always be lower than gamma |
|
|
Steps in solving ANOVA |
1. IV needs to define groups and DV needs to be IR or ordinal; otherwise incorrect application 2. Normal? (Appropriate skewness and kurtosis, at least 10 cases in each group); otherwise incorrect application 3. P value for levenes less than or equal to alpha? If yes, add caution 4. P value for f test less than or equal to alpha? If yes, likely true (with caution if equal variances not assumed or if DV is ordinal) if No, likely false. |
|
|
Steps in solving Chi-square |
1. Is DV nominal, ordinal, dichotomous, or grouped interval? If no, incorrect application 2. Are any expected cell counts less than 5? It yes, incorrect application 3. Is p value for the chi square less than alpha? If no, likely false |
|
|
If the 2 variables are statistically independent |
Then the observed frequencies would not differ significantly from the expected frequencies |
|
|
Expected frequency marginal |

|
|
|
Chi-square formula |

|
|
|
Degrees of freedom for chi square |

|
|
|
Proportional Reduction of error |
|
|
|
Between group sum of squares |

The sum of squares deviations between each sample mean to the overall mean score |
|
|
Within group sum of squares |

Sum of squared deviations within each group calculated between each individual score and the sample mean |
|
|
Mean Square between |
Sum of squares between divided by its corresponding degrees of freedom |
|
|
Mean Square Within |
Sum of squares within divided by its corresponding degrees of freedom |
|
|
ANOVA formula |

|
|
|
Control variable |
An additional variable considered in a bivariate relationship. The variable is controlled for when we take into account its effect on the variables in the bivariate relationship |
|
|
The variability between groups is large relative to the variability within groups |
Then the means of the population from which the data were drawn are significantly different |