![]()
![]()
![]()
Use LEFT and RIGHT arrow keys to navigate between flashcards;
Use UP and DOWN arrow keys to flip the card;
H to show hint;
A reads text to speech;
56 Cards in this Set
- Front
- Back
|
Population |
Every individual in research scope |
|
|
Sample |
Selection of population tested Should reflect population |
|
|
Sample error |
Difference between sample statistic & population parameters |
|
|
Variable |
Condition that can change
Independent- changed directly
Dependent- measured change variable |
|
|
Data |
Multiple observations recorded Datum= singular |
|
|
Scores |
Observation through 1 person |
|
|
Data set |
Collection of data |
|
|
Random sample |
Every member of population has equal chance to be sampled |
|
|
Representative sample |
Sample intended to refine and select or adjust for accurate reflection of population |
|
|
Experimental method |
Only cause and effect method effect method *other than very particular case studies |
|
|
Experimental conditions |
Items that are manipulated |
|
|
Control conditions |
Remains unchanged unchanged independent variable |
|
|
Confounding variables |
Unkown/unseen factors that influence results |
|
|
Extraneous Variables |
Factors found but not intentionally studied in your experiment or test |
|
|
Third variable effect |
A type of confounding in which a third variable leads to a mistaken causal relationship between two others |
|
|
Construct |
Concept that is being observed Ex: personality |
|
|
Operational definition |
Builds a method of measure for qualitative items |
|
|
Discrete Variable |
Hard boundaries between groups |
|
|
Continuous variable |
Range/spectrum defined as a group without fixed limits |
|
|
4 scales |
Nominal Ordinal Interval Ratio |
|
|
Nominal |
Discrete, named categories Ex: child names |
|
|
Ordinal |
Descrete, ranked hierarchy Ex: school seniority classification |
|
|
Interval |
Continuous, each point reflects space from another point
Category + Hierarchy + Distance Ex: Credit score |
|
|
Ratio |
Can't be negative Interval with fixed origin Ex: °K |
|
|
Statistics does this with data (3)... |
Organization- charts/graphs & tables Summary- descriptive statistics Interprets- inferential statistics draws conclusions, hypothesis testing |
|
|
Descriptive Statistics measures (4)... |
Central tendency (average)
Variability (change of score)
Relationships (shared change)
Distortions |
|
|
Mean Median Mode |
All Averages Median- middle number of ranked list Mean- summation of numbers ÷ # of #'s Mode- most frequent # (can be multiple, or null) |
|
|
Outlier |
Rare or extreme value Interaction with mean =heavily Interaction with median = lightly Interaction with mode = none |
|
|
N-1 represents |
Degrees of freedom |
|
|
Covariance |
Measured common/avg variance Deviations of score from the mean E[(x-xbar)(y-ybar)]÷(n-1) |
|
|
Correlation |
Shared variance ÷ total variance; numerical indicator of magnitude and direction
Correlation from 1 to -1
-1= 1 increases, 1 decreases 0= nothing shared 1= everything shared |
|
|
Coefficients of determination |
% based common variance
Ratio, negatives don't exist
0 to 1 or 0% to 100%
(n€xy-€x-€y)÷ SQRT[(n€x^2-(€x)^2)][(n€y^2-(€y)^2)] |
|
|
Correlation Types (4) |
Person Product Moment- most common, interval ratio
Point biserial- 1 variable on interval scale, 1 variable on nominal scale
Spearman Rankorder- variables on ordinal scale
Phi coefficient- 2 variables on dichotomous scale |
|
|
Spurious correlation |
Illegitimate or false relation between variables due to 3rd Variable Problem or math artefact |
|
|
Chart/graph types |
Scatterplot- dots Histogram- connected columns of freq Freq Polygon- connected line of freq Pie Chart- % based portions Ogive- S-curve accumulation of freq |
|
|
Normal distributions... but can have 2 distortions.... |
Are bell shaped
Kurtosis- vertical distortion, height of tails; due to extreme values but doesn't break symmetry
Skew- horizontal distortion +Skew = above avg outliers Sk>0 -Skew = below avg outliers Sk<0
|
|
|
3 types of Kurtosis |
Mesokurtic- normal K=0 Leptokurtic- tall k>0 Platykurtic- flat k<0 |
|
|
Frequency distribution charts are... |
The most common and basic organization of data |
|
|
2 types of relative distribution |
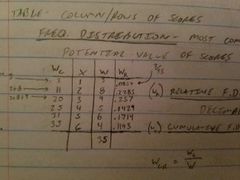
Relative- ratio, score freq÷total data
Cumulative- running tally of freq |
|
|
Positive outliers of skew are... Negative outliers of skew are... |
Above average and shift the mean more positive along the x axis Below average and shift mean more negative on the x axis |
|
|
Classic true score model |
[ X]Observed score = [T]rue score + [E]rror |
|
|
True score and error |
T: average score one gets on an infinite number of test in parallel format E: difference between actual test score and True score |
|
|
Random error |
Affects score through pure chance and is inconsistent Ex: guessing, distractions |
|
|
Systematic error |
Effects score because one characteristic has nothing to do with the measured constructs or has serious flaw Content samples- flaw of test containing wrong subject material |
|
|
Administration error & Score error |
Can be both Random & Systemic Admin: usually procedural Score: difference of raters |
|
|
Test retest reliability |
Determine tests consistency over time. Scores of the same test compared |
|
|
Parallel reliability |
Test 1 vs Test 2 with scores correlated (shared variance) Test 1 --> time--> Test2 |
|
|
Inter rater reliability |
Consistency of individual scores and ratio of agreement |
|
|
Internal consistency reliability |
Determines consistency of individual items within a test compared to each other
Likert Scale: 1=Hate -> 10=Love Cronbach's Alpha |
|
|
Validity & 3 types |
Content. Criterion. Construct.
determines if test measures what you intend to measure |
|
|
Internal & External Validity |
IV: how much the independent variable changes the dependent variable EV: application of data/study to the population |
|
|
Content validity |
Degree of items comprising tests are representative of entire theoretical constructs Needs a clearly defined content domain and reviewed by subject matter experts |
|
|
Criterion validity |
What purpose and when is test valid
Test1 --> time --> Test1 --> compare Post-detective- historical score Predictive- old score v. Future action Concurrent- 2 "present" measures compared |
|
|
Construct validity |
Does it measure an underlying idea Ex: gravity, personality Quantifying the qualitative |
|
|
Poponderance |
51% in favor |
|
|
What is alpha? |
the likelihood that the true population parameter lies outside the confidence interval (in the extreme tails .025).
Alpha is usually expressed as a proportion.
A=.05 |