![]()
![]()
![]()
Use LEFT and RIGHT arrow keys to navigate between flashcards;
Use UP and DOWN arrow keys to flip the card;
H to show hint;
A reads text to speech;
38 Cards in this Set
- Front
- Back
|
Statistical Science
|
The science of making decisions when faced with uncertainty
|
|
|
Population
|
The set of objects an experimenter wants to study or draw conclusions about.
|
|
|
Sample:
|
A subset of the population
|
|
|
Parameter
|
*From population *Unknown *A numerical characteristic of the population |
|
|
Statistic
|
*Comes from sample *Known *A numerical characteristic of the sample |
|
|
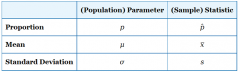
2 popular parameter/ statistic combos.
|
|
|
|
Statistical inference |
The act or procedure pf using statistics from a sample to learn or infer about parameters from the population. |
|
|
Variable of interest
|
*The item which is measured from the objects that make up our sample *Whether or not.. (yes/no) *What the #s are |
|
|
Value of Statistic
|
*Gonna be a # * EX: 3/14 |
|
|
Suppose we're interested in seeing if the proportion of SFA students that eat at Einstein's Bro. Bagels is greater than 50% and we asked the 24 students in this class. |
*Population: All SFA students *Sample: The 24 students in this class * Parameter: p= the proportion of all SFA students who eat at Einstein's. *Statistic: ^p= the proportions of the 24 students in this class that eat at Einstein's. -Value of Statistic: 9/24 *Variable of Interest: Whether or not a student eats at Einstein's |
|
|
Qualitative Data |
*Data that is naturally categorized * Nominal *Ordinal |
|
|
Nominal |
Qualitative data that does not involve order. Ex: color, preference, gender, major, type of.., cars, shoes, etc. |
|
|
Ordinal Data |
Qualitative data that does involve order. Ex: size, small, medium, large, short or tall, rich or poop, job ranking, classification, etc. |
|
|
Quantitative Data |
*Data that is naturally numerical *Discrete *Continuous |
|
|
Discrete
|
Quantitative data that has a countable # of outcomes (to the nearest) Ex: # of.. cars, students, etc. |
|
|
Continuous |
Quantitative data that has an uncountable # of outcomes Ex: Age, weight, temperature, ss #, measurement in general, time. |
|
|
Bernoulli trial
|
*A trial that has exactly 2 outcomes *Ex: flipping a coin (H or T), gender (F or M), dead or alive, pass or fail, win/lose, on/off, etc. |
|
|
Null Hypothesis (Ho)
|
The hypothesis if no change
|
|
|
Alternative hypothesis (Ha) |
The hypothesis the researchers is trying to prove.
|
|
|
Example. |
Court room: Ho: the defendant is innocent Ha: the defendant is guilty |
|
|
ALWAYS
|
Jury is told to assume defendant is innocent until proven guilty
|
|
|
Hypothesis Testing: 2 possible decisions
|
* Reject Ho and accept Ha (there is enough evident to be true) *Fail to reject Ho (not enough evidence to be proven true) |
|
|
Ha: |
< left tailed test > right tailed test = two tailed test |
|
|
Binomial Distribution |
Assumptions: 1.) Bernoulli trials 2.) Independent Trials 3.) Constant p (pie) |
|
|
Null Distribution |
-x (x-bar) -t-distribution with df= 17 Test Statsic: t=x-m/s/ square root of n |
|
|
Type 1 Error |
Reject Ho and accept Ha when Ho (in reality) is true.
|
|
|
Type II Error
|
Fail to reject Ho, when Ha (in reality is true)
|
|
|
Significant level |
The probability of making a type I error
|
|
|
Significance level |
The smaller alpha is, the lower chances of making type one error, but the chances of making a type II error would be higher.
|
|
|
3 Most Common Significance levels
|
.01, .05, .10
|
|
|
If you fear.. |
* If you fear type I error more, set alpha= .01 * If you fear type II error more, set alpha= .10 * If you fear type III error more, set alpha= .05 |
|
|
Small p-value |
If the p-value is smaller than alpha then your decision would be to Reject Ho and accept Ha
|
|
|
Large p- value
|
If the p-value is larger than alpha then your decision would be to Fail to reject Ho
|
|
|
P-value= alpha
|
If the p-value is equal to the alpha, then no decision could be made and the decision would be that they are too close to be able to make a decision.
|
|
|
Central Limit Theorm |
- Let X1,X2,....X10 be a random sample from some population with m & standard deviation of o. If n is sufficiently large (typically then distribution of the < 30) sample mean is approximately normal with a mean mx- = malpha
|
|
|
What are the two requirements to be able to use the t-distribution? |
We must assume that we are sampling from a normal population and that o is unknown.
|
|
|
If alpha = .10 and the p-value is calculated to be .051 would you be able to make a decision? If not, why not? If so, what is your decision? |
Yes, because the p-value is lower than the alpha number which means Ho is low, so the decision would be to reject Ho and accept Ha.
|
|
|
|
|