![]()
![]()
![]()
Use LEFT and RIGHT arrow keys to navigate between flashcards;
Use UP and DOWN arrow keys to flip the card;
H to show hint;
A reads text to speech;
22 Cards in this Set
- Front
- Back
|
Types of studies |
Expermental, Observational |
|
|
Large set of data |
Population |
|
|
Smaller Representation of data |
Sample |
|
|
variability |
error |
|
|
Best sampling technique |
Simple Random Sample(SRS) |
|
|
Types of Variables |
Categorical/ Quanitative |
|
|
Types of studies |
Enumerative-Well defined(study of our class) Analytical- Abstract population doesn't exist at once(cars on a street between a few hours)
|
|
|
Steps of Stats |
Step 1:Collect Info Step 2:Summirize Info step 3:Draw conclusions |
|
|
For skewed data whats the best mesurement |
Median |
|
|
Variance and standard deviation are |
Strongly affected by outliers |
|
|
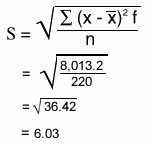
Standerd devation |

|
|
|
If we multiply all of the numbers in the data set by a non-zero constant c, the effect is to |
multiply the variance by the square of c multiply the standard deviation by c |
|
|
Roughly of the data fall within one standard deviation of the mean |
68% |
|
|
Roughly of the data fall within two standard deviations of the mean |
95% |
|
|
Roughly of the data fall within three standard deviations of the mean |
99.7 % |
|
|
IQR contains |
50% of the observations |
|
|
not as sensitive to shape of distribution or to extreme values |
IQR |
|
|
IQR works in that cases |
All cases, regardless of shape |
|
|
Measures of Centrality |
Mean/ Median / Mode |
|
|
Measures of Variablity |
Variance(Std dev), Range, IQR |
|
|
For symmetric distributions |
mean = median = mode |
|
|
For positively skewed distributions |
mean > median |

