![]()
![]()
![]()
Use LEFT and RIGHT arrow keys to navigate between flashcards;
Use UP and DOWN arrow keys to flip the card;
H to show hint;
A reads text to speech;
19 Cards in this Set
- Front
- Back
|
Frequency distribution |
Lists each category of data and the number of occurrences for each category of data |
|
|
Relative frequency |
The proportion (or percent) of observations within a category. = Frequency / sum of all frequencies |
|
|
Relative frequency distribution |
Lists each category of data together with the relative frequency |
|
|
Bar graph |
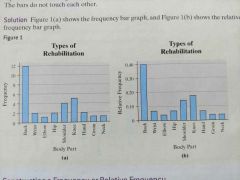
|
|
|
Pareto chart |
A bar graph who's bars are drawn in decreasing order of frequency or relative frequency. |
|
|
Pie chart |
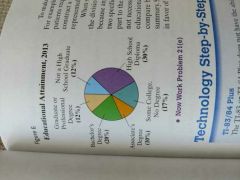
|
|
|
Histogram |
A ________ is constructed by drawing rectangles for each class of data. The height of each rectangle is the frequency or relative frequency of the class. The width of each rectangle is the same and the rectangles touch each other. |
|
|
Lower and upper class limits |
The smallest and largest values within a class. |
|
|
Class width |
The difference between consecutive lower class limits. = Largest data value - smallest data value / number of classes |
|
|
Stem and leaf |
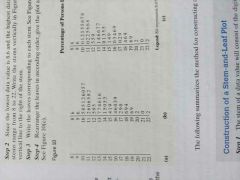
|
|
|
Split stems |
If their is a lot of data bunched together, split the stems. 2|11234 2|5566788 |
|
|
Dot plot |
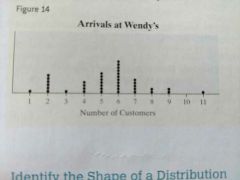
|
|
|
Open ended class |
If the first class has no lower limit or if the last has no upper limit |
|
|
Class midpoint |
The sum of consecutive lower classes decided by 2 |
|
|
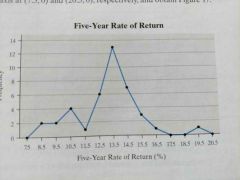
Frequency polygon |
|
|
|
Cumulative frequency distribution |
Displays the aggregate frequency of the category. |
|
|
Cumulative relative frequency distribution |
Displays the proportion of observations less than or equal to the category. |
|
|
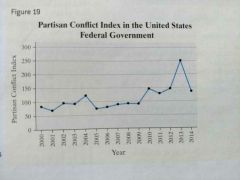
Time series plot. |
|
|
|
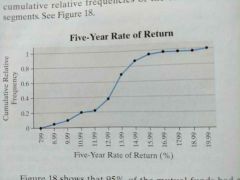
Ogive |
|