![]()
![]()
![]()
Use LEFT and RIGHT arrow keys to navigate between flashcards;
Use UP and DOWN arrow keys to flip the card;
H to show hint;
A reads text to speech;
73 Cards in this Set
- Front
- Back
|
Cohen's effect - small and how do you find it ? |
0.20 when comparing 2 groups we take the differences of their means and divide it by the SD. |
|
|
Cohen's effect medium and how do you find it |
0.50 and you find the differences of both groups means and divide it by the SD |
|
|
Large Cohen's effect and what does it measure? |
The magnitude of an effect and large is 0.80 |
|
|
Partial eta squared - what does it measure |
Effect size |
|
|
Partial eta squared - what does it measure |
Effect size |
|
|
Small partial eta squared is... |
.02 |
|
|
Partial eta squared - what does it measure |
Effect size |
|
|
Small partial eta squared is... |
.02 |
|
|
Medium partial eta squared is |
.13 |
|
|
Partial eta squared - what does it measure |
Effect size |
|
|
Small partial eta squared is... |
.02 |
|
|
Medium partial eta squared is |
.13 |
|
|
Large partial eta squared is classed as |
.26 |
|
|
Correlations can also measure |
Effect size |
|
|
Correlations can also measure |
Effect size |
|
|
If r=.10 is what size is the effect size? |
Small |
|
|
Correlations can also measure |
Effect size |
|
|
If r=.10 is what size is the effect size? |
Small |
|
|
If r=.30 What size is the effect size? |
Medium |
|
|
Correlations can also measure |
Effect size |
|
|
If r=.10 is what size is the effect size? |
Small |
|
|
If r=.30 What size is the effect size? |
Medium |
|
|
what is the large effect sizes in correlation? |
.50 |
|
Front (Term) |
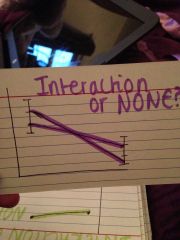
NONE as both means are similar on both sides (tasks). So there was an effect on the DV on both iv's. |
|

|
No interaction as the patterning hasn't changed from task to task |
|
Front (Term) |
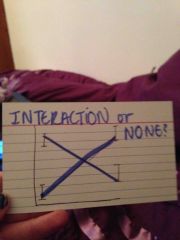
There is an interaction as there is a difference in both conditions (the dv increases on one iv and decreases on the other) |
|
|
What are the three assumptions/worries in factorial ANOVA? |
Normality Levene's test Mauchly's test |
|
Front (Term) |
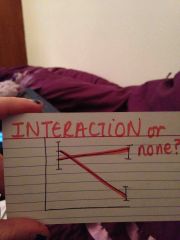
Yes there is an interaction as means we're close together initially but big difference in end. |
|
|
Where does the f ratio come from? |
Mean square divided by error mean square |
|
|
Mixed factorial ANOVA, what table do we find it in? |
BOTH TABLES BETWEEN TESTS AND WITHIN SUBJECTS EFFECTS. |
|
|
Mixed factorial ANOVA, what table do we find it in? |
BOTH TABLES BETWEEN TESTS AND WITHIN SUBJECTS EFFECTS. |
|
|
What is an interaction? |
Happens in ANOVA. Where the effect on one of the iv's on the dv's differs across the levels on the other dv. |
|
|
Levenes test, what does it test? |
ANOVA Tests whether we have homogeneity of variances If levene's data is significant we need to transform data. |
|
|
Mauchly's test of sphericity when do we use it and when is it significant? |
We use it for repeated measures and mixed design as need three or more levels. If significant we use the greenhouse grosser and hunh delft corrections. |
|
|
What is the main ANOVA table for repeated measures factorial ANOVA |
Tests of within subjects effects |
|
|
What is the main ANOVA table for repeated measures factorial ANOVA |
Tests of within subjects effects |
|
|
Total variance, how do we find it? |
Difference between the mean scores and actual scores squared and added together |
|
|
Simple regression - what is it? |
A straightforward extension of correlation. |
|
|
If you have a correlation of R=.40 what % is the variance in variable A that can be explained by variable B? |
16% As 40 X 0.40 = 0.16 |
|
|
If you have a correlation of R=.40 what % is the variance in variable A that can be explained by variable B? |
16% As 40 X 0.40 = 0.16 |
|
|
Bartlett's test of sphericity What is it and what is the assumption? |
figures out correlations of variables we want 0 correlations and we want it to be dig so p<.05 |
|
|
Working out variance with the mean: |
Find the difference between actual score and mean Eg mean = 10 actual score = 8 (10-8) squared and then add them all up to find out how many units |
|
|
Working out variance with the mean: |
Find the difference between actual score and mean Eg mean = 10 actual score = 8 (10-8) squared and then add them all up to find out how many units |
|
|
What are the cronbachs alpha thresholds? |
0.60 too low ( unless v short questionnaire) 0.70- acceptable 0.80-good 0.90- excellent (maybe too high) |
|
|
Total variance explained table - what do you use it for? |
We use it to work out how many factors to extract. |
|
|
Kolmogorov - smirnov test What do you use it for? When? What table is it found in? What is the assumption? |
Tests the distribution of data used on a large sample size of 50 participants or more P>.05 V sensitive so b careful |
|
|
Homoscedasticity what is it for and where do we look for it? |
Tells us whether the residuals differ at different predicted scores. We look at the ZPRED &&ZRESID plots |
|
|
What does 'how each item loads onto each factor' mean? What table is it on? |
How much each item belongs to a factor, it is found on the rotated component matrix |
|
|
Good or bad homoscedasticity? |
Good as all residuals are random |
|
|
On the graph....r=.67 R(squared) =.0.45 Y=16.18 + 1.08(X) What does this all mean? |
R= correlation R(squared) = the line explains 45% of the variance in data. Y is the line of best fit. |
|
|
What is the determinant value? |
Tests correlations between variables we want the determinant value to be LARGER than .00001 |
|
|
What to say if the regression scores are different to actual scores |
"Some error/residual variance left unexplained by the regression model" |
|
|
How do we know if a regression model is significant? |
P<.05 change predictor variables until both are sig. |
|
|
When looking at any influential cases you need to look at |
OUTLIERS be alarmed if outliers average are 3x bigger than the leverage values
Cook's distance is more than 1.
Mahalanorbis distance if n=100 worry if MD >15 If n =500 worry if MD >25 |
|
|
Depression score = 16.18+1.08(rumination score)
So if participant 1 has the rumination score =30 what is the depression score? |
16.18+1.08(30) So 16.18 +32.4=48.58 Only multiply the second number |
|
|
How do you find the r squared value? |
The regression value divided by total this can be found in the SPSS ANOVA table |
|
|
Cronbach's alpha if deleted - where to find it and what does it show? |
Found in the item total statistics it shows whether cronbach's alpha will be IMPROVED or REDUCED if you remove that particular item |
|
|
What should the Eigen value be? + what table is it in? |
Eigenvalue> 1 |
|
|
Kaiser-Meyer-olkin measure what is it and what are the thresholds? |
Calculates the sample size varies from 0-1 Below 0.50 - need to collect more data 0.50-0.70 -mediocre 0.70-0.80- good 0.80-0.90- great 0.90+ superb
(Rule of thumb is 300 pp's should be ok 10-15 pp's per variable) |
|
|
Cronbach's alpha - what is it? |
It tests the internal reliability ARE THE ITEMS MEASURING THE SAME THING? |
|
|
F(*1,*2) =*3, p=.*4 n(squared)=.*5 What are they all? |
*1= df *2 error *3 = f ratio *4 =sig *5= partial eta squared |
|
|
Main table for independant factorial anova |
Tests of between subjects effects |
|
|
Mixed factorial ANOVA is |
All participants do all conditions for one iv For the other iv participants only complete one condition |
|
|
Independant factorial ANOVA is |
Participants only complete one condition |
|
|
Independant factorial ANOVA is |
Participants only complete one condition |
|
|
Repeated measures factorial ANOVA is |
All participants complete all conditions |
|
|
3 different types of factorial ANOVA are |
Independant Mixed Repeated measures |
|
|
Independence of residuals- what do we look at? |
Look at the dustbin-Watson it should be approximately 2 (The errors should be independant and not correlated) |
|
|
Normality of residuals |
The errors should be normally distributed. Only 5% of cases should have residuals more than 2 SD's away from the mean. |
|
|
Multiple regression |
Simple regression can sometimes have the predictor variables correlating with eachother so we enter them together into the analysis and that's multiple regression |
|
|
In ANCOVA a table called estimates is produced. What does it show ? |
It produces the adjusted means whilst controlling any covariates. |