![]()
![]()
![]()
Use LEFT and RIGHT arrow keys to navigate between flashcards;
Use UP and DOWN arrow keys to flip the card;
H to show hint;
A reads text to speech;
93 Cards in this Set
- Front
- Back
|
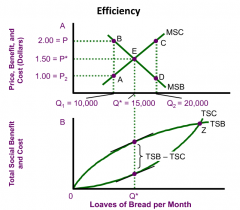
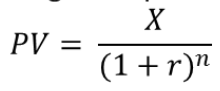
efficiency |
|
|
|
cost benefit analysis |
comparison of costs and benefits of public goods projects to decide if they should be undertaken |
|
|
3-steps to cost benefit analysis |
1. enumerate all costs and benefits of the proposed project 2. evaluate all costs and benefits in $ terms 3. discount future net benefits |
|
|
how to determine costs |
must include all costs list direct resource costs and any costs not reflected in prices of inputs (i.e. externalities) es.) loss of output from another program |
|
|
how to determine benefits |
dive into direct and indirect benefits |
|
|
direct benefits |
those increase in output or productivity attributable to the purpose of the product |
|
|
indirect benefits |
those accruing to individuals not directly associated with the purpose of the project |
|
|
why evaluate costs and benefits in dollars? |
in order for benefits to be comparable, they must be in the same units, i.e. dollars |
|
|
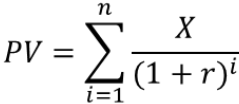
present value |
the maximum amount you would be willing to pay today for the right to receive the money in the future |
|
|
discounting |
the process of imputing an interest rate in order to arrive at PV |
|
|
PV Equation |
|
|
|
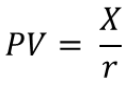
PV that yield benefits over a number of years equation |
|
|
|
PV that yields benefits fall into the future (50 years or more) equation |
|
|
|
discount rate |
r |
|
|
discount factor |
(1+r)^n |
|
|
discount rate for private firm |
opportunity cost of what else the firm could do with the same funds (the after tax rate of return) |
|
|
discount rate for government |
based on private sector opportunity cost (government counts both after-tax portion of the return AND the taxes collected) |
|
|
admissible |
are the benefits greater that the costs? |
|
|
preferable |
are the net benefits the highest? |
|
|
admissible (in terms of PV) |
PV of discounted net benefits is positive |
|
|
Preferable (in terms of PV) |
PV of discounted net benefits is highest (when projects are mutually exclusive) |
|
|
economic costs (opportunity costs) |
the value of the resource in its next best use |
|
|
rent |
payment in excess of what is necessary to employ the resource |
|
|
rent |
payment in excess of what is necessary to employ the resource |
|
|
reservation wage |
value of leisure time expressed by workers |
|
|
leisure time |
cost to society for hiring unemployed labor |
|
|
road repair example (for reservation wage) |
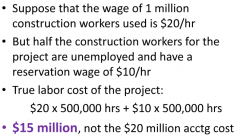
|
|
|
imperfectly competitive markets |
inputs produced in imperfectly competitive markets also produce rents prices for the input will overstate the actual cost of creating the input P>MSC true cost to society will be overstated |
|
|
key issues with measuring benefits |
1. avoid double counting 2. don't include pecuniary spillovers 3. subtract subsidies 4. calculate shadow prices |
|
|
avoid double counting |
focus on the physical output of the project ex.) irrigation project- do not include both the value of additional crop grown AND the increase in the value of land |
|
|
pecuniary externalities |
effects on third p;parties are not "true" externalities when they are included in prices |
|
|
pecuniary spillovers |
should not e included when measuring benefits of projects |
|
|
subract subsidies |
the price of the output may be inflated due to subsidies |
|
|
shadow prices |
estimated prices for goods that do not have an explicit market ex.) look at the relationship b/w distance from the park (travel cost) and number of visits |
|
|
world bank definition of poverty |
hunger lack of shelter being sick and not being able to see a doctor not being able to go to school not knowing how to read not having a job losing child to illness due to unclean water powerlessness |
|
|
poverty: relative measures |
based on individual's income relative to the income of other in the economy (significantly less than average) implies that poverty rate never changes |
|
|
problem with relative measure |
does not address quality of life at the bottom of income distribution |
|
|
Fuchs point |
defines poor as those with incomes less than 1/2 of the median income for the nation means that you could reduce poverty rate Fuchs point is changeable |
|
|
poverty: absolute measures |
based on individual's ability o purchase some bundle of goods specific level of income below which a person is considered to be impoverished income needed to assure min subsistence ex.) minimum caloric intake for survival |
|
|
Poverty in US |
measured using absolute approach |
|
|
poverty threshold |
level of income below which a household is classified as poor in US 2011: threshold was $22,811 per year for family of 4 adjusted annually for inflation but NOT adjusted for geographic differences in cost of living |
|
|
CEA line |
dates back to 1963 ($3,000/yr/fam) based on "minimally adequate diet" for family of 4; $1,000 per year for food low income families were found to spend 2/3 of income on non-food items |
|
|
SSA Index |
adjusted CEA line for family size and number of people in the family over age of 65 uses equivalency scale |
|
|
what is current poverty rate? |
between 12% and 15% elderly have lowest poverty rate (SS, medicare) children have highest poverty rate |
|
|
poverty gap |
how far below the poverty line is the income of poor people |
|
|
problems with measuring poverty |
1. "in-kind" income not included 2. underreporting 3. income mobility 4. uncounted poor 5. latent poverty |
|
|
"in-kind" income |
from govt: food stamps, medicaid/medicare, subsidized housing, energy assistance, etc. from relatives/friends/private organizations: babysitting, meals, transportation, gifts. etc. |
|
|
underreporting |
fear off losing benefits income from illegal sources |
|
|
income mobility |
many spells of poverty are fairly short 3 out of 5 families move out of poverty within one year 1 in 10 families stay in poverty more than 5 years |
|
|
uncounted poor |
not everyone is included in the poverty surveys (homeless, institutionalized) disguised poverty: household structure may include members not sharing equally in household income |
|
|
latent poverty |
government transfers lift 46.6% of pre-transfer poor out of poverty SS accounts for largest reduction in the "official poor" |
|
|
social insurance |
poverty may be due to factors beyond one's control (i.e. ill health) |
|
|
public good |
everyone may be better off if low-income people are better cared for |
|
|
protection |
reduce likelihood of riots, revolution |
|
|
private vs. government charity |
private contributions fall in periods of poor economic performance free rider problem government is coercive solution |
|
|
status test |
ensure that people belong to a particular group i.e. disabled, elderly, families w/ dependent children |
|
|
who is eligible for anti-poverty programs? |
pass status test pass means test |
|
|
means test |
income and asset levels that are below the minimally required amounts to justify assistance |
|
|
cash transfer anti-poverty programs |
TANF SSI EITC |
|
|
TANF |
for the poor temporary and limited family support through grants to state governments |
|
|
SSI |
for the old, blind, and disabled |
|
|
EITC |
general assistance paid upon tax filing |
|
|
in-kind anti-poverty programs |
medicaid SNAP |
|
|
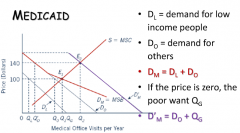
medicaid |
basic health care services for the poor |
|
|
SNAP |
formerly food stamps; EBT cards redeemable for food and related programs |
|
|
constrained utility maximization |
perfectly rational consumers pursuing self-interest based one preferences and budget |
|
|
preferences |
what a consumer wants expressed in terms of utility (indifference curves) |
|
|
budget |
what a consumer can afford |
|
|
three key assumptions of rational behavior |
completeness transitivity monotonicity |
|
|
completeness |
consumer can make a decision a>/=b or b>/-a or a~b |
|
|
transitivity |
consistent choices if a>b and b>c, then a>c |
|
|
monotonicity |
more is better than less |
|
|
indifference curve |
typically shown in the context of a two-good world, on a 2-dimensional graph Properties: every bundle is ons one indifference curve, two curves never cross, not "thick", slopes downward, bundle that has more of all goods is on a higher indifference curve ("no satiation") |
|
|
indifference map |
all of a consumer's indifference curves |
|
|
utility function |
mathematical representation of a person's preferences |
|
|
utility function formula |
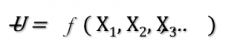
|
|
|
indifference |
as you move along a given indifference curve, you give up some of one good, but get ore of the other. you are therefor INDIFFERENT |
|
|
indifference curve example |
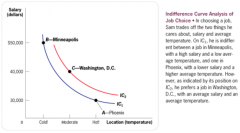
|
|
|
marginal rate of substitution |
slope of indifference curve rate at which consumer is willing to trade off the two goods ex.) how many more movies would the consumer require to compensate him for the loss of a CD? |
|
|
marginal rate of substitution formula |
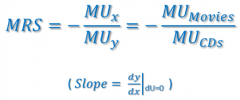
|
|
|
budget constraint |
the amount of money a consumer has to spend on goods and services |
|
|
budget constraint formula |

|
|
|
budget constraint graph |
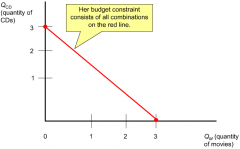
|
|
|
constrained utility maximization graph (highest utility within budget constraint is middle line) |
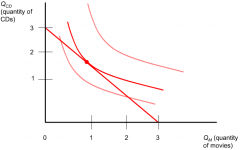
|
|
|
constrained utility maximization formula |

|
|
|
substitution effect |
change in consumption due to change in relative prices, holding utility constant |
|
|
income effect |
change in consumption due to feeling "poorer" after price increase |
|
|
Superiority if income grant to subsidy |
|
|
|
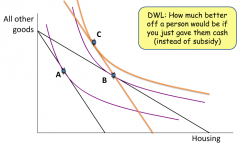
excess burden of a subsidy |
|
|
|
why use in-kind benefits instead of cash? |
in-kind benefits can only have a value less than or equal to cash benefit 1. paternalism 2. political support from producer groups 3. merit goods 4. target efficiency 5. target efficiency 5. moral hazard |
|
|
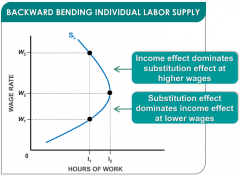
how does rise in wage rate effect income and substitution? |
income effect: consume more leisure time (work less) substitution effect: consume less leisure time (work more), the rise in the wage rate increases the opportunity cost of leisure time |
|
|
rise in wage rate graph |
|
|
|
earned income tax credit (EITC) |
introduced in 1975 to offset increases in FICA taxes (aka payroll or SS taxes) |