![]()
![]()
![]()
Use LEFT and RIGHT arrow keys to navigate between flashcards;
Use UP and DOWN arrow keys to flip the card;
H to show hint;
A reads text to speech;
51 Cards in this Set
- Front
- Back
|
Factors involved in Personality |
1. Genetic Influences: Our genes help to shape our interests and personality 2. Environmental factors: a) Shared Environment: Things that make us tend to be like others who we share an environment with b) Non-Shared Environment: Things we experience uniquely that shape us differently from everyone else |
|
|
Phenotype |
Phenotypic characteristic is any measurable or observable aspect of who we are i.e. hair, personality
Phenotype is the set of all these measurable and observable aspects of us
Genotype is that set of genes we inherit from our parents |
|
|
Twin Studies |
Monozygotic (MZ) twins develop from a single fertilized egg and are therefore genetically identical (100%) Dizygotic (DZ) twins who develop from two simaltaneously fertilized eggs, and are therefore no more similar in genotype than any pair of siblings (50%) |
|
|
Twin Studies: Reared Together and Apart
|
If the correlation for IQ is 100% is genetically determined then the twins raised together or apart will have a correlation of 1.00 For DZ twins the correlation is .50 |
|
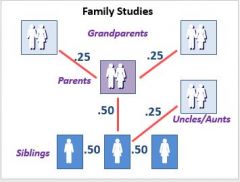
Family Studies |
Since studies of heritability only require that we compare the phenotupic similarity of people with different degrees of genetic similarity,we need not use twins in our studies |
|
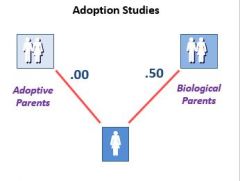
Adoption Studies |
Adopted children have no genetic overlap with their adoptive parents If a phenotypic characteristic is 100% determined by genes, we expect there to be essentially no correlation between children and their adoption parents, but a 50% correlation between children and their biological parents |
|
|
Problems with Studies |
DZ twins confused as MZ twins at birth
|
|
|
Problems with Studies: |
We make an assumption that MZ twins reared apart live in different environments
However when twins are reared apart, adoption agency tries to match the twins to similar families so there would be similarities |
|
|
Problem with Studies: Differences between MZ and DZ twins in environmental similarity |
We assume that MZ and DZ twins are reared in the same environments
Parents of MZ often create very similar environments
Parents of DZ often create different environments to rear them -This overestimates the influence of genes |
|
Problem with Studies: |
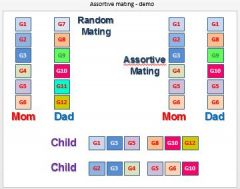
We choose our mates based on genetic similarity But we assume that parents contirbute 50% each to the child's genetic makeup. So in this case, when the mother and father shar emore genes in common and the child inherits those genes, it is perceived that there is a great contribution from one of the parents This overestimates the influence of genes |
|
|
Distributions and Variance |
The variance of a distirbution of numbers is a measure of the varibility of those scores around the mean (or average) score |
|
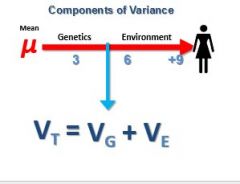
Components of Variance |
(1) Variance due to genetic differences between the people who provided the scores in our distribution (2) Variance due to differences in the environments of the people who provided our scores. |
|
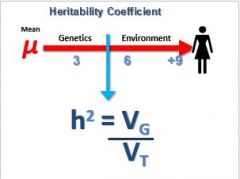
Heritability Coefficient |
The heritability coefficient for some phenotypic characteristic is the ratio of the genetic variance (Vg) to the total variance (Vt) |
|
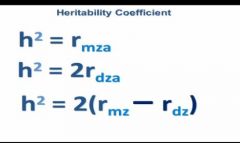
Formulas for the Heritability Coefficient |
(1) Used when the data available consists of correlations between pairs of monozygotic twins reared apart (MZA) (2) Used for calculating the heritability coefficient when the data consists of DZ twins reared apart (DZA) (3) Used when the data consists of both correlations between pairs of MZ twins, and pairs of DZ twins |
|
|
Heritability Coefficient: What it isn't |
Heritability Coefficient is about where the variance in a group or population comes from I.e. all the variance in IQ in the population half of that is attributable to environment and half attributable to genetics |
|
|
Heritability Coefficient: What it isn't Varies from popul'n to popul'n, over time |
Heritability coefficient is not a constant. If the genetic pool in Sweden is smaller, the genetic variance will be lower and therefore the heritability coefficient will be higher. |
|
|
Heritability Coefficient: What it isn't Valid only if measures used to calculate it are valid |
Twin studis are often invalid because of assumptions we make |
|
|
Heritability Quotient |
The heritability Quotient merely tells how much of the total variability in some phenotypic characteristic can be attributed to genetic variability within our sample |
|
|
Thomas, Chess & Birch (1970) |
The study by Thomas, Chess and Birch was one of the first attempts to define early measures of temperament. They assessed infants |
|
|
Thomas, Chess & Birch (1970) |
Positive response to new object. Regularity in biological functions Friendliness or good mood Adapts to changes in environment Usual Degree of energy in responding(intensity)
|
|
|
Thomas, Chess & Birch: Easy |
Regular rhytms Good mood Accepts novelty Adapts well to change Low to moderate levels of energy |
|
|
Thomas, Chess & Birch: Difficult |
Irregular rhythms Poor mood Dislikes novelty Adapts poorly to change High levels of energy |
|
|
Thomas, Chess & Birch: What they found |
It was found that most of the kids had a high correlation of thei rtemeprament forma ge 1 to age 14. They also showed how being Easy or difficult had an effect ontheir mental wellbeing. |
|
|
Plomin & Rowe (1979) |
The Plomin & Rowe study examined 21-month-old MZ and Dz twin for their similarity in several aspects of sociability in a situation in which they interacted with a stranger. -Looking at stranger -Approaching stranger -Nearness to Stranger -Vocalizing to Stranger |
|
|
Plomin & Rowe: The results |
The contrast effect in which DZ correlations ar emcuh smaller than they should be given the relative genetic similarity of MZ and DZ twins |
|
|
Buss & Plomin (1984) |
Buss & Plomin developed a 20-item EAS survey (taken by the parents) to evaluate children on the three important dimension of temperament. Their survey of MZ and Dz twins found high heritability coefficients for all three, but complicated by the same sort of contrast effect that Plomin & Rowe had reported five years earlier |
|
|
Buss & Plomin: The 3 Dimensions of Temperament |
Emotionality Activity Sociability |
|
|
Why a Contrast Effect?: Non-Additive Variance |
The data assumes 100% that genes in your genotype show up in your phenotupe, but this isn't the case |
|
|
Non-Additive Variance |
Dominant-recessive effects: What shows up in th ephenotype depend sonw hat particular allele is dominant int he genotype. MZ have the same alleles but DZ twins could have different ones |
|
|
Non-Additive Variance |
Epistatic effects: When one gene somewhere in a genotype affects the expression of one of them. Once again, MZ twins share 100% of both additive and non-additive genetic effects. Dz twins share 50% of additive effects but only 25% of non-additive effects |
|
|
Why a Contrast Effect?: Epigenetic Effects |
The epigenome is a set of chemical instructions for gene expression It differentiates cell types in organs It is passed on to offspring, affected by environment and experience |
|
|
Epigenetic Effects: Environments not equal |
We assume that the similarity between the nevironments of DZ twins is the same as the ismilarity in the environments of MZ twins |
|
|
Environments not Equal: Contrast Effects |
Parents of DZ twins often work hard to differentiate their environments to emphasize their uniqueness |
|
|
Environments not Equal: Assimilation Effects |
Parents of MZ twins often work to make their two environments even more similar than they would otherwise be |
|
|
Jerome Kagan and Behavioural Inhibition: Identifying Behaviourally Inhibited Children |
He did a study and took 117 Caucasian 22-month old boys in playroom: Mom and examiner join child on floor, act otu behaviours of varying complexity.Examiner leaves, stranger (Female adult) enter, asks child to join her. Examiner returns, reveals noisy robot to child, suggests child approach, touch robot. Examiner leaves, mother leaves-child alone |
|
|
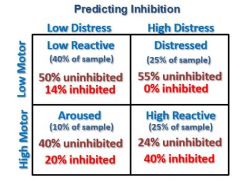
Jerome Kagan and Behavioural Inhibition: Results |
Some show fear in most situations: Inhibited (10%) Some show no fear in an situation: Uninhibited (20%) Remainder show mixed reactions: Middling (70%) |
|
|
Behaviourally Inhibited Children |
Slow to start conversation with unfamiliar adult or peer. Seldom smile spontaneously with unfamiliar other. Slow to relax in unfamiliar situations. Memory impaired following stress. Cautious decision makers (low risk takers). Unusual fears or phobias. |
|
|
Physiology of Inhibited Children |
HR up during stress, or when stand up Diastolic BP up when stand up (more dramatic) More rapid pupillary dilation under stress Higher muscle tension Higher right frontal cortex activation More allergies More activity in HPA axis, RAS, ANS (sympathetic branch) |
|
|
Inhibition and Somatotype |
Kagan reported several intriguing relationshups between behavioural inhibition and several other aspects of appearance and body shape 60% of inhibited children have blue eyes 60% of uninhibited children have brown eyes More kin of inhibited children have blue eyes; of uninhibited have brown Inhibited boys have narrow faces, thin builds |
|
|
Predicting Inhibition |
|
|
|
Loehlin & Nicholas (1976) |
A study by Loehlin and Nichols looked at the correlations between DZ and MZ twins on a number of personality variables Studied 850 pairs of same-sex twins who took the NMST in 1962 514 MZ pairs and 336 DZ pairs 41% males and 58% females Filled out personality & interest tests; parents completed questionnaires |
|
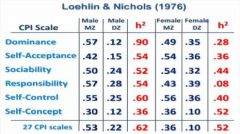
Loehlin & Nichols: Results |
Notice the high heritability coefficients for male twins, and the presence of large contrast effects in the male twin data. L & N concluded that the average heritability coefficient for personality characteristics was about 50% |
|
|
Tellegen et al (1988) |
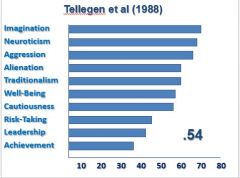
They took the data of one of the studies and measured the correlation coefficients of twins reared apart |
|
|
Scarr et al (1981) |
Compared two groups of families: 1. 234 biological children (mean age 18 years) in 120 families 2. 194 adopted children (mean age 18 years) un 115 families |
|
|
Scarr et al: They measured... |
Introversion SOcialibility Anxiety Emotionality |
|
|
Scarr et al |
Heritability estimates for personality: .22 (parent-child similarity) .26 (sibling-sibling similarity) |
|
|
Swedish Adoption/Twin Study on Aging (SATSA) |
With MZA, DZA, MZT and DZT twins, they were able to calculate heritability using a variety of different formulas |
|
|
Shortcomings of h2 Calculations |
Ignores environmental effects that bias calculations All the studies assume only additive genetic variance; non-additive variance is assumed as zero No separate calculation shared vs non-shared environmental affects |
|
|
SATSA Variances |
The SATSA authors were able to separately estimate the amount of variance attributable to the several different factors that contribute to phenotypic variability |
|
|
SATSA VAriances: |
Genetics 29% Shared Environment 9% Non-Shared Environment and Error 62% |
|
|
Non-Shared Environmental Effects |
Differential treatment by parents Different interaction with siblings Birth order Sibling age spacing Gender differences Different school experiences Different friends, playmates |