![]()
![]()
![]()
Use LEFT and RIGHT arrow keys to navigate between flashcards;
Use UP and DOWN arrow keys to flip the card;
H to show hint;
A reads text to speech;
6 Cards in this Set
- Front
- Back
|
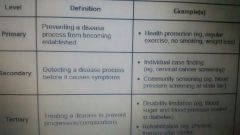
What are the levels of prevention? |
|
|
|
What do you know about " Stages of change" model ? |
It was originally developed to help pts quit smoking. It assesses an individual's readiness to change a problem behavior. It has five stages: 1.Precontemplation: not thinking about behavior modification. 2.Contemplation: thinking about behavior modification. 3. Preparation: planning behavior modification. 4. Action: putting plan into action. 5. Maintenance: maintaining new behaviour. |
|
|
What is correlation coefficient |
Correlation coefficient = r It shows degree of correlation bw one variable with other. Can be +ve inc exercise, inc metabolism Can be -ve inc age dec bone mass It lies bw -1 & +1 If r = +1 perfect +ve r If r = -1 perfect. -ve r If r = >0.5 strong +ve r If r =<0.5 strong -ve r If r = 0 to 0.5 or 0 to -0.5 : weak +ve or -ve correlation
|
|
|
Tyes of correlation coefficient CC/r |
2 types: 1. Pearson product correlation PPC: Used in interval or ratio data 2. Spearman rank order correlation (p): Used in ordinal data PPC is used in linear relationship, if they are not linear PPC is inaccurate. The larger the sample size, closer the CC/r is likely to be to the true population. If p value for CC/r is low, then reject null hypothesis and consider cc/r obtained for that sample is statistically significant. |
|
|
Does correlation coefficient cc/r mean causation? |
No |
|
|
What is coefficient of determination? |
Its r^2/R^2. It tells you what fraction of variation of one variable is explained by its relationship to other variable as opposed to natural variation within each variation. If CC/r bw insulin levels and glucose is 0.74 then r^2 is 0.74 * 0.74 = 0.55. 55% of variability in glucose is linked with changes in insulin levels whr as 45% of variability is due to other factors such as measurement error or natural variability in glucose concentration. |