![]()
![]()
![]()
Use LEFT and RIGHT arrow keys to navigate between flashcards;
Use UP and DOWN arrow keys to flip the card;
H to show hint;
A reads text to speech;
447 Cards in this Set
- Front
- Back
- 3rd side (hint)
|
What is project management? |
Getting from point A to point B as effectively and efficiently as possible Or The application of knowledge, skills, tools and techniques to project activities to meet the project requirements |
|
|
|
Project vs. Operation |
Projects are temporary and operations are ongoing (to sustain organization) |
|
|
|
Examples of operations |
Production, manufacturing, accounting, customer service, etc. No end date for operations |
|
|
|
Programs |
Programs are a collection of related projects that are coordinated, for example and developments, new technological infrastructure |
|
|
|
Portfolios |
Collection of projects and programs that are prioritized and aligned with strategic business activities. They contain projects and programs which may not be related. |
Cars |
|
|
PMO |
Project management office |
|
|
|
What is a PMO? |
Provide centralized and coordinated management of projects. Key stakeholder and decision maker |
|
|
|
Primary functions of a PMO |
*manage shared resources * maintain project management best practices and standards *develop policies, procedures, templates, etc *coordinate communications * coaching, mentoring, training, oversight, and monitoring *governance organization |
|
|
|
Three types of PMO |
1. Supportive 2. Controlling 3. Directive |
|
|
|
Supportive PMO |
Primarily supporting organization, provides templates, best practices, training, etc. No authority to enforce. |
Low degree of control |
|
|
Controlling PMO |
Provide support but also requires adherence to certain standards, methodologies, etc. Same as supportive, but authority to ensure adherence. |
Moderate degree of control |
|
|
Directive PMO |
Controls projects by managing them directly. Estima supportive and controlling, but full control. |
High degree of control |
|
|
OPA |
Organizational process assets |
|
|
|
What is OPA? |
Process related assets that can be used to influence the project's success |
|
|
|
Two main categories of OPAs |
1. Process and procedures ( how the work SHOULD be done). Standards, policies, work instructions, templates, change control procedures. Standard instructions. 2. Corporate knowledge base (how did the work actually get done in past). Project files, historical information, configuration management knowledge bases, financial databases |
Review before projects will allow to get better. Pg 27-28. |
|
|
EFF |
Enterprise environmental factors |
|
|
|
What are EFFs? |
Internal and external factors that may influence the project success. Generally intangible and not process specific. Think of this as the world we work in |
|
|
|
EFF examples |
*culture *industry standards *infrastructure *market condition (strikes, etc) *political climate of organization *work authorization system *project management information system *existing human resources (people) *software *standards (LG) |
Pg 29 |
|
|
EFF or OPA |
Generally speaking, the different theater will be the OPA's are generally unique to your organization. If it is something housed in your corporate knowledge base, it should be an OPA (templates, policies) |
|
|
|
Project life cycle |
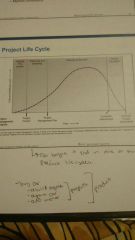
Can begin and end in one or more product life cycles |
|
|
|
Product life cycle |
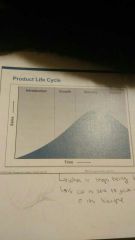
And when it stops being that product. If car is sent to junk yard that's the end of its life cycle |
|
|
|
Project phases |
Divisions within project 1. Feasibility 2. Design 3. Develop 4. Deploy |
|
|
|
Process groups |
Initiate, plan, execute, monitor and control, close |
|
|
|
Process group vs project phase |
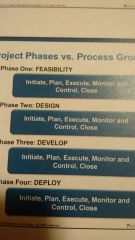
Process groups happen at each project phase. At the end of each is a phase gate and possible kill point |
|
|
|
Project phase relationships |
1. Phase to phase 2. Predictive life cycles 3. Iterative and incremental life cycles 4. Adaptive (change driven or agile) |
|
|
|
Phase to phase relationships |
Sequential: face can only start once a previous phase has completed. Overlapping: phase starts prior to the completion of the previous phase |
|
|
|
Stakeholders |
-Typically are actively involved in project. - interested may be positively or negatively impacted by the project - could influence the project |
|
|
|
Stakeholder examples |
-End user -Customers, vendors, partners -Upstream or downstream system -Sponsor, program/ portfolio manager, PMO -functional or operational managers - nonhuman, animals, air, water, land (represented by humans/ organizations) |
|
|
|
Organizational influences |
* corporate and societal culture (EFFs- shared work beliefs, expectations, norms, work ethic, work hours, views of authority) * organizational structure within company (functional vs matrix vs projectized |
Pg 21-26 |
|
|
Pros and cons of organizational types |
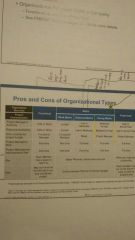
Assume strong matrix |
|
|
|
Pros and cons of a functional organizational structure |
Pro: team member has a place to return to Con: may not have the full skill set to run and coordinate project |
|
|
|
Pro and con of weak/ balanced/ strong matrix organizational structure |
Pro: better p.m. skills, shared resource pool
Con: conflict between pm and functional manager |
|
|
|
Pro and con of projectized organizational structure |
Pro: PM's have high level of authority Con: team members may be on the bench or have no work at project's end |
|
|
|
Roles within organizational structure |
Project expediter Project coordinator Project manager |
|
|
|
Project expediter |
Staff assistant to the executive who has responsibility for the project. Can make few if any decisions. Primary responsibility lies in ensuring the timely arrival of resources. |
|
|
|
Project coordinator |
Reports to a higher level in the hierarchy period has authority to assign worked individuals, but lacks full of thority of project manager. As defined by PMI |
|
|
|
Project manager |
Sole person Tasked with achieving the project objectives. Lead person responsible for communicating with all stakeholders including sponsor. May report to a functional manager or program or portfolio manager. |
|
|
|
Project selection methods |
*Mathematical approach ( constrained optimization methods) * comparative approach (benefit measurement methods) |
|
|
|
Mathematical project selection approaches |
-linear approach - integer approach - dynamic approach - multi objective approach |
|
|
|
Project selection comparative approaches |
Project to project or compare project to desired outcome -scoring model - peer review - murder boards - Economic models |
|
|
|
Comparative approach scoring models |
which project to select based on risk, resources, etc |
|
|
|
Murder boards |
Panel that tries to poke holes in your argument |
|
|
|
Comparative approach economic models |
- cost benefit analysis - payback period - discounted cash flows - net present value - internal rate of return (IRR) |
|
|
|
Benefit cost analysis (BCR) |
Compares project benefits to the cost to drive a ratio from which a decision can be made. For example, if a project generates $125,000 in benefits and costs $50,000, the benefit cost ratio would be 2.5 (5:2) BCR=1 is breaking even |
|
|
|
Payback period |
The number of periods required to recover a project cost. For example, if a project cost 1 million dollars and will generate revenue of $100,000 per year, than the payback period would be 10 years. |
|
|
|
Discounted cash flow |
Calculates in today's (discounted) terms of what the value of a project would be, given cash inflows and outflows over a period of time. At a particular interest rate |
|
|
|
Present value (PV) |
- a formula that calculates the value today of a future cash flow PV = FV/ (1+I)^n |
|
|
|
Internal rate of return (IRR) |
- the discount interest rate when the NPV equals zero or less (concept only on exam) - always choose the project with the highest positive IRR, reject negative - assume that cash flows are reinvested at the IRR value |
|
|
|
Sunk costs |
Project costs spent to date |
|
|
|
Law of diminishing returns |
Adding more resources doesn't proportionately increased productivity |
|
|
|
Working capital |
Current assets minus current liabilities |
|
|
|
Depreciation |
Straight line (same amount each year), accelerated (examples: double declining balance and sum of years digits) |
|
|
|
Assumptions |
Something that is believed to be true or something that is taken for granted. Source of risk |
|
|
|
Constraints |
A factor that limits the project team's options, any restriction placed on the project. Examples: resources, schedule, budget, scope, etc Dates are always classified as a constraint. Never a requirement |
|
|
|
Opportunity cost |
The opportunity given up by choosing another project |
The lower the opportunity cost, the better |
|
|
Progressive elaboration |
Starting with a broader plan, then planning in greater detail as time goes by and information becomes available. Estimates get more accurate. |
|
|
|
Following values should be its highest possible when selecting between projects |
Benefit cost ratio Net present value Return on investment Irr |
|
|
|
For the following, the lower value is better |
Opportunity cost Payback period |
|
|
|
The project team |
Includes the project manager, the project management team, and team members. Carry out the work Determine which processes are needed, called "tailoring" Prepare estimates Initially resolve interpersonal conflict |
|
|
|
Project management team |
A subset of the project team and is responsible for the project management and leadership activities of the project |
|
|
|
Project management team responsibilities |
- the sponsor is not part of this team, works directly with it. Helps remove road blocks for the project management team. - the initial planning work is done by the project management team - may help write the project charter - analyze and understand scope - assess team effectiveness. Whole project management team's responsibility. |
|
|
|
Process |
A set of interrelated actions and activities performed to achieve a pre-specified product, result, or service. Each process has an input and output. |
|
|
|
Each individual process has: |
- inputs - tools and techniques -output |
|
|
|
Inputs |
Any item that is required by a process before that process proceeds |
|
|
|
Tools |
Often something that is tangible, such as a template, chart, or software program, used in performing an activity to produce a product or results |
|
|
|
Technique |
A defined, systematic procedure to perform an activity to produce a product or result or delivery service, and that may employ one or more tools |
|
|
|
Output |
A product, service, or result generated by a process |
|
|
|
5 process groups |
Logically grouped subsets of project management processes (which do not always occur sequentially) -initiating -planning -executing -monitoring and controlling -closing |
|
|
|
Initiating |
Process group Defining a new project or new phase of an existing project ; obtaining authorization to start the project or phase ; setting high level expectations |
|
|
|
Planning |
Process group Establishing the complete scope of the project, defining the objectives and refining courses of action taken to attain the objectives |
|
|
|
Executing |
Prices group Performing the works defined in the project management plan to satisfy the project specifications |
|
|
|
Monitoring and controlling |
Tracking, reviewing, and regulating the oeuvres and performance of the project; identifying areas in which changes to the plan are required; documenting and implementing the corresponding changes. |
|
|
|
Closing |
Finalizing all activities across all prices groups to formally close the project or phase |
|
|
|
10 knowledge areas |
-project integration management -project scope management -project time management -project cost management -project quality management -project human resources management -project communication management -project risk management -project procurement management -project stakeholder management |
|
|
|
Project integration management |
PM's primary focus -incorporating and organizing the project work - processes and faces get defined, integrated, consolidated, and unified here |
|
|
|
Integration management processes |
-develop project charter - develop project management plan - direct and manage project work - monitor and control project work - perform integrated change control - close project or phase |
|
|
|
Initiating process group |
- define initial, high-level requirements - initial scope is set, stakeholders are identified, and financial resources are committed - to gain authorization to start a new project or phase |
|
|
|
Initiation group processes |
-develop project charter - identify stakeholders |
|
|
|
Develop project charter |
This process formally authorizes the existence of a project and provides the project manager with the authority to apply organizational resources to project activities. |
|
|
|
Develop project charter inputs |
-project statement of work (SOW) -business case -agreements -enterprise environmental factors (EFFs) - organizational process assets (OPAs) |
|
|
|
Project statement of work (SOW) |
The narrative explanation of what the project in Tales, this includes the business need, scope description, and organization's strategic plan This is the highest level of scope description |
|
|
|
Business case |
Business reason project is being done Market demand, organizational need, strategic opportunity, customer request, ecological impact, social need |
|
|
|
Agreements |
Contracts, letters of intent, etc |
|
|
|
EFFs |
Government standards, organizational culture, market conditions, industry standards, etc |
|
|
|
OPAs |
Templates, historical information, lessons learned |
|
|
|
Develop project charter tools and techniques |
-expert judgement -facilitation techniques |
|
|
|
Expert judgement |
The use of knowledge, training, expertise, or judgment. The skills of the experts needed on the project. |
|
|
|
Expert judgment can come from: |
-Subject matter experts (SME) - stakeholder, customer, sponsors, etc - consultants - professional or technical associations - industry groups - project management office (PMO) |
|
|
|
SME |
Subject matter experts |
|
|
|
Facilitation techniques |
Brainstorming, conflict resolution, problem solving, meeting management |
|
|
|
Develop project charter outputs |
Project charter |
|
|
|
What may a project charter include? |
- project purpose or business justification - project description, goals, objectives, and success criteria. ( specific, measurable, attainable, relevant, timely) - high level requirements, risks, milestones, and budget - identifies responsibility and authority level for project manager and sponsor - identifies what constitutes project success and who makes that decision sign off. One person or group. - preassigned resources if any may be identified here. P.m. is named on the project charter. |
|
|
|
Project stakeholder management |
Insurance the effective communication and management of stakeholders |
|
|
|
Project stakeholder management processes |
-identify stakeholders -plan stakeholder management - manage stakeholder engagement - control stakeholder engagement |
|
|
|
Identify stakeholders |
Process of identifying all people or organizations that are impacted by the project, and documenting how they are impacted, and their involvement level |
|
|
|
Identify stakeholders inputs |
Procurement documents |
|
|
|
Procurement documents |
If the project is the results of a procurement activity or contract, the parties to that contract are key stakeholders. Iterative, updated, ongoing -As subs are hired, their added (contracts with subs) |
|
|
|
Identify stakeholders tools and techniques |
Stakeholder analysis and meetings |
|
|
|
Key stakeholders |
Decision making ability anywhere in the process |
|
|
|
Profile analysis Meetings |
Profile analysis meetings are designed to develop an understanding of major project stakeholders. Team decides who key stakeholders are. |
|
|
|
Stakeholder analysis |
-A technique to systematically determine whose interests should be taken into account throughout the project. - identifies interests, influence, and expectations |
|
|
|
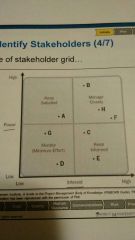
Stakeholder analysis steps |
1. Identify all potentials stakeholders. Talk to currently identified stakeholders to find more stakeholders. 2. Analyze potential impact each stakeholder (may be groups) 3. Assess how each key stakeholder will likely react or respond to various situations |
|
|
|
Stakeholder quad grid |
|
|
|
|
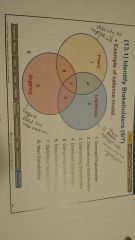
Example of stakeholder salience model |
|
|
|
|
Identify stakeholders output |
Stakeholder register |
|
|
|
Stakeholder register |
- identification information (name, organization, role, location, contact information) - assessment information (expectations, influence, interest) - classification (internal, external, attitude) The stakeholder register should be consulted and updated as needed. Excel is the best tool. |
|
|
|
Process planning group |
- total scope definition of curves and bass lines are set, accepted and approved version - planning is an iterative process - totally define every part of project specifics |
|
|
|
Project management plan |
-Guides overall execution of the project. -Documenting what needs to be done to define, prepare, integrate, and coordinate all subsidiary objectives - incorporates the outputs from most of the other planning processes into one document |
|
|
|
Who should sign off on the project management plan |
The project manager, the sponsor, the project team, and key stakeholders |
|
|
|
16 elements of a project management plan |
- the nine knowledge area plans - the three baselines ( scope, schedule, cost) -4 additional ( change, configuration, requirements, process improvements) |
|
|
|
Change management plan |
Documents how change will be controlled. Part of the project management plan. |
|
|
|
Change control system |
A system to track and manage changes. ( any software package is eff, could be eff or OPA (filling)). Part of the project management plan |
|
|
|
Configuration management plan |
Version control plan and product features that are configurable. Part of the project management plan |
|
|
|
Configuration management system |
Part of the project management information system (PMIS) is that tracks and manages changes to the deliverable version control. System used to manage configuration is an eff. Part of the project management plan |
|
|
|
PMIS |
Project management information system |
trucks and manages changes to deliverables. Version control. |
|
|
Process improvement plan |
Defines how you will improve the project management process to be a more efficient project manager. Part of the project management plan |
|
|
|
At what point in the project should we have a fully completed project management plan? |
End of planning, but before execution |
|
|
|
Project scope management |
Ensures all required work is done and no unnecessary work is done (in scope vs out scope) |
|
|
|
Product scope |
The features, functions that characterize a product, service, or result. Project scope is measured against the project management plan, whereas product scope is measured against the product requirements |
|
|
|
Project scope management processes |
-plan scope management -collect requirements -define scope -create WBS - validate scope - control scope |
|
|
|
Plan scope management |
The process of creating a scope management plan that documents how the project scope will be defined, validated, and controlled |
|
|
|
Scope management plan |
- a document that describes how the scope will be defined, developed, monitored, controlled, and verified. How we're going to do things. Does not include scope. |
|
|
|
What does a scope management plan include? |
- process for preparing a scope statement. Who writes, reviews, etc - process for developing, approving, and maintaining the work breakdown structure WBS - process specifying how formal acceptance of deliverables will be attained. Sign at the end of Project payment might count - process for requesting, making changes to scope statement |
|
|
|
Requirements management plan |
Output of plan scope management. A how to, does not contain requirements. - how requirements will be planned, tracked, and reported - how impacts will be analyzed, traced, tracked, and reported - prioritisation process - product metrics. which ones and why - attributes to be captured on the traceability matrix |
|
|
|
Collect requirements |
The process of determining, documenting, and managing stakeholder needs and requirements to meet the project objectives |
|
|
|
Collect requirements inputs |
Stakeholder management plan |
|
|
|
Stakeholder management plan |
- create list right after identifying stakeholders - identifies the management strategies required to effectively engage stakeholders |
|
|
|
Collect requirements tools and techniques |
- interviews - focus groups - group creativity techniques - questionnaires and surveys - observation - prototypes - benchmarking - context diagrams - document analysis |
|
|
|
Interviews |
Collect requirement tool and technique. Asking questions and documenting responses. Subject matter experts (SME) |
|
|
|
SME |
Subject matter experts |
|
|
|
Focus groups |
Conversing with a group of SMEs with a trained moderator. Collect requirements tool and technique |
|
|
|
Facilitated workshop |
Cross-functional meeting Collect requirements tool and technique |
|
|
|
Group creativity techniques |
Brainstorming, nominal group technique (ranking and voting), idea mind mapping, multi-criteria decision analysis, and affinity diagram. Collect requirements tool and technique |
|
|
|
Group decision making techniques |
Unanimity all agree, majority (greater than 50%), plurality (largest block), and dictatorship. Collect requirements tool and technique |
|
|
|
Questionnaires and surveys |
SharePoint. Collect requirements tool and technique |
|
|
|
Observations |
Job shadowing (follow) versus participant observer. Requirements of task or job position. Collect requirements tool and technique |
|
|
|
Prototypes |
Models, mockups, draft, at cetera. Collect requirements tool and technique |
|
|
|
Benchmarking |
Comparison versus a standard. Microsoft Office is a productivity benchmark. Collect requirements tool and technique |
|
|
|
Context diagrams |
Visually depicts relationships between systems, processes, and people. Collect requirements to land technique |
|
|
|
Document analysis |
Analyzing documentation to help identify requirements. Collect requirements tool and technique |
|
|
|
Collect requirements outputs |
- requirements documentation - requirements traceability matrix |
|
|
|
Requirements documentation |
Word file or requirements traceability matrix. Describes how individual requirements meet the business need and includes several components. Not part of the project management plan. It is considered a project document. |
|
|
|
Requirements documentation components |
- business requirements - stakeholder requirements - solution requirements - project requirements - transition requirements - requirements assumptions, dependencies, constraints |
|
|
|
Business requirements |
Business and project objectives for traceability, business rules, guiding principles. Part of the requirements documentation |
|
|
|
Stakeholder requirements |
Impact to other organizational areas, impacts to other entities. Part of requirements documentation |
|
|
|
Solution requirements |
Functional and non functional, support and training, quality standards. Part of requirements documentation |
|
|
|
Project requirements |
Levels of service, performance, acceptance. Part of requirements documentation |
|
|
|
Transition requirements |
Temporary capabilities during transition period. Part of requirements documentation |
|
|
|
Requirements traceability matrix |
Done in Excel. Tracing requirements for the following areas: - business need, opportunity, goal, objective - project objectives, scope, WBS deliverables - product design - product development - test strategy and test scenario - high level requirements to more detailed requirements - other columns: description, owner, source, priority, status, acceptance criteria |
|
|
|
Requirements traceability matrix example |
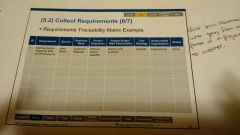
Don't miss requirements when going from one phase of a project to another |
|
|
|
Define scope |
Outlines with the project includes and what it excludes. Detailed definition of the project |
|
|
|
Define scope tools and techniques |
- product analysis (what should go into the product) - alternatives generation (high altitude view of the entire project. Come up with alternative ways of getting the project done. Unique approach. Project level) |
|
|
|
Product analysis |
- product breakdown, systems analysis, requirements analysis, systems engineering, and value engineering - only for projects that have a product as a deliverable |
|
|
|
Alternatives generation |
- identifying alternative approaches to complete the project. Brainstorming, lateral thinking, analysis of alternatives, etc |
|
|
|
Lateral thinking |
A highly creative approach, this relies on reasoning that is not immediately obvious and generate ideas not generally obtainable using traditional parameters (thinking outside the box) |
|
|
|
Define scope outputs |
- project scope statement - project documents updates |
|
|
|
Project scope statement |
- detailed description of the project deliverables and the work required to create those deliverables - product scope description, acceptance criteria, deliverables, inclusions, exclusions, constraints, assumptions |
|
|
|
Project documents updates |
Stakeholder register, requirements documentation, requirements traceability matrix, etcetera |
|
|
|
Create WBS |
- process of subdividing project deliverables into more manageable parts. Deliverable-oriented hierarchy of the project work Every piece of work gets included (100% rule) Lowest level = work package |
|
|
|
Decomposition |
Breaking project work and deliverables down into smaller, more manageable components |
|
|
|
Five steps of decomposition |
1. Identify the deliverables and work 2. Organize the WBS. Phase, deliverable, etc 3. Decompose the WBS into lower level components 4. Assign unique identification codes (collectively known as the code of accounts) 5. Verify the WBS. Verify all elements of the project are included. Level of breakdown is sufficient one person group is responsible for each element |
|
|
|
Create WBS outputs |
- scope base line. Approved and accepted starting point - project requirements updates |
|
|
|
Scope baseline |
- project scope statement - WBS - WBS dictionary |
|
|
|
Project scope statement |
Detailed description of the project deliverables and the work required to create those deliverables |
|
|
|
WBS |
Hierarchical to decomposition of the total scope of work to be performed. Types of breakdown: by phase of the project life cycle, by major deliverable, by subproject |
|
|
|
WBS dictionary |
Description of work, responsible persons or organization, milestone schedules. Describes each work element, who's responsible |
|
|
|
Control account |
A management control point where scope, budget, actual cost, and schedule or integrated and compared to earned value for performance measurement. Previously called cost account |
|
|
|
Planning package |
Work breakdown structure component below the control account with known work content, but without detailed schedule activities. Site mob demob, fixed price, don't need to break it down |
|
|
|
Work package |
Work defined at the lowest level of the WBS, for which accurate cost and duration can be estimated and managed. One step removed from an activity list |
|
|
|
Code of accounts |
Any numbering scheme used to uniquely identify each component of the WBS |
|
|
|
Chart of accounts |
A list detailing all accounts used by the organization to identify areas of expenditures not part of the WBS itself. Billing vendors and labour separately. |
|
|
|
Project time management |
Processes required to manage timely completion of the project |
|
|
|
Project time management processes |
- plan schedule management - define activities - sequence activities - estimate activity resources - estimate activity durations - develop schedule - control schedule |
|
|
|
Plan schedule management |
The process of establishing the policies, procedures, and documentation for planning, developing, managing, executing, and controlling the project schedule |
|
|
|
Planned schedule management tools and techniques |
Analytical techniques- choosing the appropriate options to help estimate, developed, and manage the schedule. He scheduling methodology, scheduling tools and techniques, estimating approaches, formats, and project management software |
|
|
|
Plan schedule management outputs |
-Schedule management plan |
|
|
|
Schedule management plan |
A component of the project management plan, it sets forth the approaches used and activities needed to develop and manage the schedule |
|
|
|
What does the schedule management plan establish? |
- scheduling methodology and tools used - level of accuracy needed for duration estimates - units of measure, such as staff hours - process used to update the status and record progress of the project - variance thresholds indicating allowable schedule variation before action must be taken |
|
|
|
Define activities |
The process of identifying the specific actions required to complete the project work. |
Activities are not on WBS. WBSD composes the project down to the work package level, but here we decompose those work packages down further into discrete activities |
|
|
Rolling wave planning |
The process of planning near-term activities in great detail and longer term activities at high level. This is an iterative, ongoing process, and is a form of progressive elaboration. |
Can be done at activity level or WBS higher level |
|
|
Define activity outputs |
- activity list - activity attributes - milestone list |
|
|
|
Activity list |
Detailed list of all activities that are required to complete the project. Sufficient detail that the project team members understand what work is required |
|
|
|
Activity attributes |
Details that further explain the activity such as activityid, WBS ID, activity name, description, predecessor, successor, leads, lags, the person responsible, constraints, assumptions, location, level of effort, etc |
|
|
|
Milestone list |
A list of significant points in a project. Ie submission to the FDA, development of a prototype |
|
|
|
Sequence activities |
Process of identifying and documenting relationships among project activities. Putting activities in the proper order. Can do right after defining activities. |
|
|
|
PDM |
Precedence diagramming method |
|
|
|
Precedence diagramming method (PDM) |
A method used in critical path methodology to build a network diagram showing activity relationships - also known as activity on node (AON) |
|
|
|
CPM |
Critical path methodology |
|
|
|
AON |
Activity on node |
|
|
|
Four types of PDM relationships |
- finish to start: A finishes before B starts - finish to finish: A finishes at the same time/ before B finishes - start to finish: -A starts before B finishes - start to start: A starts before B starts |
|
|
|
Dependency determination |
- mandatory: also called hard logic or hard dependents. You have to build the walls before the roof - discretionary: also called soft logic. Preferred logic. Arbitrary. Prefer to paint walls before lay carpet - external : outside the project teams control. Must wait for FDA approval before proceeding with next step. - internal: generally within the control of the project team |
|
|
|
Lead |
Allows an acceleration of a successor activity. Always a negative number |
|
|
|
lag |
Delay |
|
|
|
Sequence activities outputs |
- project schedule network diagrams - project documents updates |
|
|
|
Project schedule network diagrams |
A visual representation of the relationship between schedule activities. Just relationships, not a schedule yet |
|
|
|
Three types of float |
-Total float (slack) -free float -project float |
|
|
|
Total float (slack) |
The amount of time that is scheduled activity can be delayed without delaying the project completion date. Total float does not get added together. Float is shared across a path. |
|
|
|
Free float |
The amount of time that has scheduled activities can be delayed without delaying the successor activity. This is calculated by subtracting early finish plus one of the current activity from the early start of the successor activity. ES-(EF+1) |
|
|
|
Project float |
The amount of time a project can be delayed, without impacting the externally imposed project deadline set by the customer or management |
|
|
|
Modeling techniques, develop schedule |
-What - if scenario analysis: changing conditions to simulate different possible scenarios and outcomes - simulation: Monte Carlo analysis ( random, iterative computer model showing probability distributions) |
|
|
|
Simulation modeling technique |
Monte Carlo analysis. Random, iterative computer model showing probability distributions |
|
|
|
Leads and lags |
Head Start (lead) and delay (lag). Adjust with Leads (compression of time) and legs (expansion) |
|
|
|
Schedule compression |
-crashing - fast tracking |
|
|
|
Crashing |
Adding resources to critical path tasks, which exchanges higher cost for shorter schedule duration. Try to do this at the lowest incremental cost. Add resources to shorten time |
|
|
|
Fast tracking |
Converts sequential activities to parallel, which increases risk. Any length of overlapping, even 30 minutes |
|
|
|
Scheduling tool examples |
Microsoft Project, Excel |
|
|
|
Develop schedule outputs |
- schedule baseline - project schedule - schedule data - project calendars |
|
|
|
Schedule baseline |
Accepted and approved version of the schedule. Part of develop schedule outputs. |
|
|
|
Project schedule |
Planned start and finish dates for each activity. -Milestone chart, bar chart, project schedule network diagram. |
Different from the schedule baseline |
|
|
Schedule data |
Include schedule milestones, scheduled activities, activity attributes, assumptions and constraints constraints. May also include resources by time Period, alternative schedules, contingencies. Part of develop schedule output |
|
|
|
Project calendars |
Identifies working days and shifts that are available for scheduled activities. Don't confuse with resource calendars. Parts of develop schedule outputs |
|
|
|
What project documents updates may have to be done as part of develop schedule outputs? |
Activity resource requirements, activity attributes, calendar, risk register, etc |
|
|
|
Plan cost management |
The process that establishes the policies, procedures and documents for planning, managing, expending, and controlling project costs. A how to. |
|
|
|
Project cost management |
Includes the processes involved in estimating, budgeting, and controlling costs |
|
|
|
Plan cost management tools and techniques |
Analytical techniques - choosing strategic options such as self funding or financing, may also detail strategies for making, purchasing, renting or leasing. - Financial techniques employed to make project decisions may include payback period, ROI, irr, discounted cash flow, and NPV. |
|
|
|
Cost management plan |
A component of the project management plan that describes how the project costs will be planned, structured, and controlled. I |
|
|
|
Estimate costs |
The process of developing an approximation of the monetary resources needed to complete the project activities. |
|
|
|
Fixed costs |
Business expenses that are not dependent on the level of goods or services produced by the business. They tend to be time-related, such as rent being paid per month. Costs will not change. |
|
|
|
Variable costs |
Expenses that change in proportion to the activity of a business. When activity is decreased, less raw material is used, so spending for raw material falls. Will change with amount of work |
Fuel in a bulldozer |
|
|
Direct costs |
A cost that can be directly related to producing specific goods or performing a specific service. For example, the wages of an employee engaged in producing a product can be attributed directly to the cost of manufacturing that product |
|
|
|
Indirect costs |
Costs that are not directly attributable to a particular project, such as heat and light. Overhead. Benefit several projects. |
|
|
|
ROM |
rough order of magnitude. -25% to +75% ( typically used during initiation when details are not yet developed) |
|
|
|
Definitive estimate |
-5% to +10% available after execution has begun |
|
|
|
Human resource management plan |
An input of estimate costs. - a plan that provides guidance on how to project human resources should be defined, staffed, managed and eventually released. It is part of the project management plan. - cost implications: training, staffing, rewards |
|
|
|
Estimate costs tools and techniques |
- Reserve analysis - cost of quality - project management software - vendor bid analysis |
|
|
|
Reserve analysis |
Cost estimates often include contingency reserves ( based on identified risks) to account for uncertainty. These are typically derived from risk analysis. |
|
|
|
Cost of quality |
- cost of conformance: prevention ( spent to prevent errors) and appraisal costs ( spent to evaluate). Must always be added to project costs. - cost of non conformance: internal and external failure costs. Money have to spend because of errors. |
|
|
|
Project management software |
Software, spreadsheets, simulations, statistics |
|
|
|
Vendor bid analysis |
What the project should cost based on competitive bids. Just numbers. |
|
|
|
Estimate costs outputs |
- activity cost estimates - basis of estimates (BOE) - project documents updates |
|
|
|
Activity cost estimates |
Probable cost to complete the project activities. Summary or detailed. Include things not attached to project tasks. |
|
|
|
BOE |
Basis of estimates. Explanation of how cost estimates were derived, including formulas, assumptions, constraints, possible cost ranges, confidence level. Allows you to know how risky their estimates are. |
|
|
|
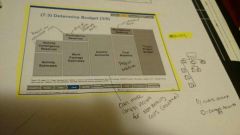
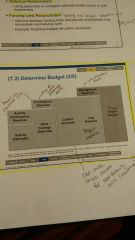
Determine budget |
The process of aggregating all activity or work package cost to establish a baseline for the project |
|
|
|
Determine budget tools and techniques |
- cost aggregation - historical relationships - funding limit reconciliation |
|
|
|
Cost aggregation |
Process of rolling up costs through each level of the WBS |
|
|
|
Historical relationships determining budget |
Using parametric or now just estimate models based on past experience |
|
|
|
Funding limit reconciliation |
Variance between funding limits and planned expenditures may necessitate rescheduling work. Making sure project baseline fits. |
Example: quarterly budgets for public companies |
|
|
Determine budget picture |
|
|
|
|
Determine budget outputs |
- cost baseline - project funding requirements - project documents updates |
|
|
|
Cost baseline |
Authorized, time saved, total project budget used to measure, monitor, and control cost performance of the project. Appears as an S curve on a graph. Cumulative line. Does not include management reserves |
|
|
|
Project funding requirements |
Total and periodic funding requirements are derived from the cost baseline. Funding maker in incremental amounts. |
|
|
|
Project quality management |
Processes that determine quality policies, objectives, and responsibilities to satisfy project quality requirements |
|
|
|
Plan quality management |
The process of identifying quality requirements or standards for the project and documenting how the project will demonstrate compliance. Do not define quality requirements here. That was collect requirements |
|
|
|
Quality management methodologies |
- Six Sigma - Lean Six Sigma - quality function deployment |
|
|
|
Six Sigma |
Seeks to improve the quality of process outputs by identifying and removing the causes of defects and minimizing variability in manufacturing and business processes. Each project follows a defined sequence of steps and has quantified efficiency target. Cost reduction and or profit increase. |
|
|
|
Lean Six Sigma |
A managerial concept that blends lean with Six Sigma to eliminate the seven kinds of ways to achieve a defect rate 3.4 defects or less per million opportunities |
|
|
|
Quality function deployment |
Seeks out customer needs, uncovers positive quality that impresses the customer and translates these into design characteristics and deliverable actions. Voice of the customer |
|
|
|
7 kinds of waste |
1. Defects 2. Overproduction 3. Transportation 4. Waiting 5. Inventory 6. Motion 7. Processing |
DOTWIMP |
|
|
Quality vs grade |
- quality is the degree to which a set of inherent characteristics fulfill requirements. - quality describes how well a product or service is made. Low quality is always bad. - grade is a Category assigned to products or services having the same functional use but different technical characteristics. Toyota vs Lexus. Low grade is fine as well as long as quality is high |
|
|
|
Prevention over inspection |
A modern quality philosophy that says quality is planned and designed in. Not inspected in. Thus, you should spend a lot of time and resources planning and managing quality in on the front end. See cost of quality. Inspections will not improve quality. |
|
|
|
Estimate activity resources |
The process of estimating the type and quantity of material, people, equipment, or supplies required to perform each activity. No specific names, three engineers |
|
|
|
Estimate activity resources inputs |
- resource calendars - risk register - activity cost estimates |
|
|
|
Resource calendars |
Calendar that identifies the working days and shifts on which each specific resources available. This includes human resources as well as quipment etc. I just as you go along. In beginning it's types and quantities |
|
|
|
Risk register |
Document in which the results of risk analysis and risk response planning are recorded. After risk planning is done, come back |
|
|
|
Activity cost estimates |
Probable cost to complete the project activities (summary or detailed). After cost estimates are done, come back |
|
|
|
Estimate activity resources tools and techniques |
- alternative analysis -published estimating data -bottom up estimating -project management software |
|
|
|
Alternative analysis |
Examples: resource skill levels, size and type of machinery, different tools, and make or buy decisions |
|
|
|
Published estimating data |
Examples: means building construction cost data |
|
|
|
Bottom-up estimating |
It's an activity can't be estimated as a whole, it can be broken down into smaller parts which are then aggregated for the estimate. This is time consuming, but also the most accurate. |
|
|
|
Project management software |
Any software you use to estimate Examples: primavera, ms project, clarity, excel. |
|
|
|
Estimate activity resources outputs |
-activity resources requirements - resource breakdown structure - project documents updates |
|
|
|
Activity resource requirements |
Identifies the types and quantities of resources required for each activity and work package. |
Estimate activity resources output |
|
|
RBS |
Resource breakdown structure |
|
|
|
Resource breakdown structure |
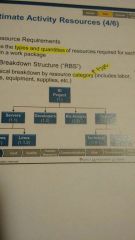
Hierarchical breakdown by resource category and type. Includes labor, materials, equipment, supplies, etc. Large projects. The numbers are not a code of accounts (only on WBS), numbers are resource codes |
|
|
|
Estimate activity resources project documents updates |
Activity list, activity attributes, resource calendars, etc |
|
|
|
Estimate activity durations |
The process of estimating the number of work periods to complete each activity with the estimated resources. |
Work periods Can be a trick on the test |
|
|
Effort |
-The number of work units reliever units necessary to finish an activity -period may be expressed as staff hours, days, or weeks |
For example, a resource could spend 10 hours (effort) over three weeks (duration) reviewing a specification. |
|
|
Duration |
The number of work periods Needed to complete an activity |
For example, a resource could spend 10 hours (effort) over three weeks (duration) reviewing a specification. |
|
|
Estimate activity durations tools and techniques |
- analogous estimating - parametric estimating -three-point estimating -group decision making -reserve analysis -Delphi anonymous |
|
|
|
Analogous estimating |
Using similar previous project as a reference for your project, making adjustments for known differences (aka top-down estimating). This is the least accurate, but most expedient method |
|
|
|
Parametric estimating |
-This employs a statistical relationship using historical data and other variables. This more accurate than analogous estimating. - based on expert judgment, historical information, etc - example colon if a resource can install 25 meters of cable per hour, the duration to install 1000 meters would be 40 hours |
|
|
|
Three-point estimating |
Three estimates from the same person. 1. Everything goes right. Optimistic estimate 2. Everything goes wrong. pessimistic estimate 3. Actual estimates - triangular distribution ( simple average) o+p+a/3 - beta distribution (PERT) Optimistic+ 4*most likely+ pessimistic/6. P+4M+O/6 |
|
|
|
PERT |
Program evaluation review technique P+4M+O/6 |
|
|
|
Group decision making techniques |
-brainstorming - Delphi technique (blind anonymous requirements gathering) - nominal group techniques |
|
|
|
Delphi technique |
Blind or nonymous requirements gathering. Would use: 1. Wide range of experience in group. All PEs, many years plus few years 2. Political or emotional factors involved |
|
|
|
Reserve analysis |
This involves out in contingency reserve to the schedule to account for uncertainties. The contingency reserve maybe a percentage of the activity duration, or fixed number of work periods. Quantitative methods such as Monte Carlo analysis may be used to help determine how much Reserve is needed. Don't pad by adding hours, identify risks and add contingency |
|
|
|
Standard deviation |
-6 Sigma: 99.9997% (3.4 defects out of 1 million) -3 Sigma:99.73% -2 Sigma: 95.46% -1 Sigma: 68.26% |
|
|
|
Duration formula |
Duration the function of effort required and resources available. D= W / R D is duration W is work (effort) R is resources |
|
|
|
Develop Schedule |
The process of analyzing activity sequences, directions, resource requirements, and schedule constraints to create the project schedule |
|
|
|
Project staff assignments |
- specifies which resources are assigned to each activity. - can be reflected via a project team directory, memos two team members, names inserted into other parts of the project management plan, etc. -irritative |
Input to develop schedule |
|
|
Develop schedule tools and techniques |
- schedule network analysis - critical path method - critical chain method - resource optimization techniques |
|
|
|
Schedule network analysis |
A technique used to generate the project schedule. Any technique. Be wearing when you see this as an answer on the test. |
|
|
|
Critical path method |
The most common develop schedule tool and technique. Calculates the possible start and finish time for activities by using a forward and backward pass analysis through the schedule network |
|
|
|
Critical chain method |
develop scheduled tool and technique. Takes the critical path method and adds resource constraints, project buffers which are at it at the end of schedule, and feeding buffers with your added to not critical path tasks which feed into the critical chain so they don't run late and delay the project completion |
|
|
|
Resource optimization techniques |
Develop schedule tool and technique. -resource leveling ( project schedule is allowed to slip) - resource smoothing (not allowing schedule to slip) |
|
|
|
Resource leveling |
Resource optimization technique. Adjusts activity start / finish dates when resources have been over allocated or certain resources are scarce. It often let's the schedules slip in order to smooth out an optimized all resources |
|
|
|
Resource smoothing |
Resource optimization technique I just activities such that the requirements do not exceed certain predefined resource limits. The schedule cannot slip with this method, so activities may only be delayed by periods of time that is equal to or less than their free and total float. This method may therefore not allow all resources to be optimized. |
|
|
|
Similarities between CPM and CCM |
Both CPM and CCM as longest duration paths through the network diagram |
|
|
|
Differences between CPM and CCM |
1. To manage the schedule, CPM uses float. CCM uses buffers. 2. CPM does not consider resource limitations |
|
|
|
Feeding buffers |
Protect critical chain from slippage |
|
|
|
Project buffer |
Just like feeding buffer, but last thing before project ends. Protects project from slippage |
|
|
|
Three types of float |
- total float (slack) - free float - project float |
|
|
|
Total float (slack) |
Amount of time that is scheduled activities can be delayed without delaying the project completion date. Total float does not get added together. Float is shared across a path. Calculated on each activity |
|
|
|
Free float |
the amount of time that is scheduled activity can be delayed without delaying the successor activity. This is calculated by subtracting the EF +1 of the current activity from the ES of the successor activity. ES- (EF+1) |
|
|
|
Project float |
The amount of time a project can be delayed, without impacting the externally imposed project deadline set by the customer or management. |
|
|
|
Develop schedule modeling techniques |
-what-if scenario analysis: changing conditions to simulate different possible scenarios and outcomes. - simulation: Monte Carlo analysis. Random, iterative computer model showing probability distributions. |
|
|
|
Develop schedule leads and lags |
Head start (lead) and delay (lag). Adjust with leads (compression of time) and lags (expansion of time) |
|
|
|
Schedule compression |
crashing and fast tracking |
|
|
|
Schedule crashing |
Adding resources to critical path tasks, which exchanges higher cost for shorter scheduled duration. Try to do this at the lowest incremental cost. Add resources to shorten time |
|
|
|
Schedule fast tracking |
Convert sequential activities to parallel, which increases the risk. Any length of overlapping, even 30 minutes |
|
|
|
Develop schedule outputs |
-schedule baseline - project schedule - schedule data -project calendars - project management plan updates -project documents updates |
|
|
|
Schedule baseline |
Accepted and approved version of the schedule |
|
|
|
Project schedule |
Planned start and finish dates for each activity. Milestone chart, bar chart, project schedule network diagram. |
|
|
|
Schedule data |
Includes schedule milestones, scheduled activities, activity attributes, assumptions and constraints. May also include resources by time period, alternative schedules, contingencies |
|
|
|
Project calendars |
Identifies working days and shifts that are available for scheduled activities. Don't confuse with resource calendars which are each resource available. Available days/time to work on project |
Develop schedule output |
|
|
Develop schedule project management plan updates |
Schedule baseline. Approved by change request. Schedule management plan |
|
|
|
Develop schedule project documents updates |
Activity resource requirements (leveling impacts), activity attributes, calendar, risk register, etc |
|
|
|
Project cost management plan |
Includes the processes involved in estimating, budgeting, and controlling costs |
|
|
|
Plan cost management |
the process that establish is the policies, procedures, and documentation for planning, managing, exchanging, and controlling costs. A how-to. |
|
|
|
Plan cost management tools and techniques |
Analytical techniques - choosing strategic options such as self funding or financing, may also detail strategies for making, purchasing, renting, or leasing. - Financial techniques employed to make project decisions main include payback period, ROI , IRR, discounted flat cash flow, and NPV |
|
|
|
Cost management plan |
A component of the project management plan that describes how the project will be planned, structured, and controlled. It can establish, in part: -units of measure ($, time, tons) - level of precision: method for rounding - level of accuracy: acceptable range of deviation for estimates. - control thresholds: acceptable cost performance variances without having to take action -earned value management rules |
|
|
|
Earned value management rules |
- where control accounts where will be placed. Control account plan - measurement techniques such as percent complete - equations for EAC |
|
|
|
Cost estimates |
The process of developing an approximation of the monetary resources needed to complete the project activities |
|
|
|
Fixed costs |
Business expenses that are not dependent on the level of goods or services produced by the business they tend to be time-related, such as rent being paid per month. Cost will not change |
|
|
|
Variable costs |
Expenses that change in proportion to the activity of a business. When activity of decreases, less raw material is used, so spending off of raw material falls. Fuel in a bulldozer |
|
|
|
Direct costs |
A cost that can be directly related to producing specific goods or performing a specific service. For example the wages of an employee engaged in producing a product can be attributed directly to the cost of manufacturing that product. |
|
|
|
Indirect costs |
Costs that are not directly attributed to a particular product, such as the heat and light. Overhead. Benefit several projects. Variable |
|
|
|
ROM |
Rough order of magnitude. -25% to +75% are typically used during initiation, when details are not yet developed |
|
|
|
Definitive estimating |
-5% to +10% Available after execution has begun |
|
|
|
Estimate costs inputs |
Human resource management plan - a plan that provides guidance on how project Human Resources be defined, staffed, managed, and eventually released. It is part of the project management plan -cost implications, training, safety, rewards |
|
|
|
Estimate costs tools and techniques |
-reserve analysis -cost of quality -project management software -vendor bid analysis |
|
|
|
Reserve analysis |
Cost estimates often include contingency reserves based on identified risks to account for uncertainty. These are typically derived from risk analysis. |
|
|
|
Cost of quality |
- cost of conformance: money spent to prevent errors. Prevention and appraisal costs - cost of non conformance: money have to spend because of errors. Internal and external failure costs |
|
|
|
Benefit bid analysis |
What the project should cost based on competitive bids. Just numbers |
|
|
|
Estimate costs outputs |
-activity cost estimates - basis of estimates (BOE) -project documents updates: risk register |
|
|
|
Activity cost estimates |
Probable cost to complete the project activities summary or detailed. Include things not attached to specific tasks |
|
|
|
BOE |
Basis of estimates. Explanation of how cost estimates were derived, including formulas, assumptions, constraints, possible cost ranges, confidence levels. Allows you to know how risky their estimates are |
|
|
|
Determine budget |
The process of aggregating all activity or work package costs to establish a baseline for the project |
|
|
|
Determine budget tools and techniques |
-cost aggregation -historical relationships -funding limit reconciliation |
|
|
|
Cost aggregation |
Process of rolling up costs through each level of the WBS |
|
|
|
Determine budget through historical relationships |
Using parametric or analogous estimate models based on past experience |
|
|
|
Funding limit reconciliation |
Variance between funding limits and planned expenditures may necessitate rescheduling work. Making sure project baseline fits. Example: quarterly budgets for public companies |
|
|
|
Determine budget |
|
|
|
|
Determine bother l budget outputs |
-cost baseline -project funding requirements -project documents updates: risk register, activity cost estimates, project schedule, etc |
|
|
|
Cost baseline |
Authorized, time saved, total project budget used to measure, monitor, and control cost performance of the project. Appears as an S curve on a graph, cumulative line. Does not include management reserves |
|
|
|
Project funding requirements |
Total and periodic funding requirements are derived from the cost baseline. Funding may occur in incremental amounts. |
|
|
|
Project quality management |
Processes that determine quality policies, objectives, and responsibilities to satisfy project quality requirements. Note: plan quality involves creating a quality management approach. Perform quality assurance ensures we are using the quality standards as planned. Control quality means evaluating the actual quality of the product |
|
|
|
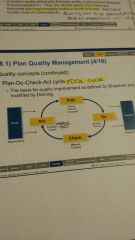
Plan quality management |
The process of identifying quality requirements or standards for the project and documenting how the project will demonstrate compliance. Do not define quality requirements here, that was in collect requirements |
|
|
|
Quality management methodologies |
-six Sigma -lean six sigma -quality function deployment |
|
|
|
Six sigma |
Quality management methodology. Seeks to improve the quality of process outputs by identifying and removing the causes of defects and minimizing variability in manufacturing and business processes. Each project follows a defined sequence of steps and has quantify deficiency targets cost reduction and or profit increase. 3.4 defects per million. |
|
|
|
Lean six sigma |
Quality management methodology. A managerial concept that blends lean with Six Sigma to eliminate the seven kinds of waste to achieve a defect rate of 3.4 defects or less per million opportunities |
|
|
|
Quality function deployment |
Seeks out customer needs, uncovers positive quality that impresses to customer and translates these into design characteristics and deliverable actions. Voice of the customer. |
|
|
|
Quality vs grade |
- quality is the degree to which a set of inherent characteristics will fulfill requirements. Corporate requirements. McDonald's quarter pounder is high quality - quality describes how well a product or service is made. Low quality is always bad. - grade is a category assigned to products or services having the same functional use but different technical characteristics. Toyota vs Lexus. Low grade is fine as long as quality is high |
|
|
|
Prevention over inspection |
A modern quality philosophy that says quality as planned in and designed, not inspected in. Thus you should spend a lot of time and resources planning and managing Quality in on the front end. Quality has to be planned, designed, and built into product. Inspections will not improve quality |
|
|
|
PDCA cycle |
Plan, do, check, act cycle. The basis for quality improvement as defined by Shewhart and modified by Deming. Continuous improvement process |
|
|
|
Plan quality management tools and techniques |
- cost benefit analysis - cost of quality (COQ) - seven basic quality tools |
|
|
|
Cost benefit analysis |
High quality results in less rework, higher productivity, lower cost and increased stakeholder satisfaction |
|
|
|
Cost of quality (COQ) |
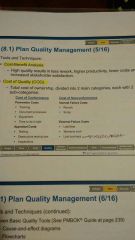
Total cost of ownership, divided into two main categories, each with to subcategories |
|
|
|
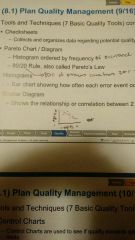
Seven basic quality tools |
- cause and effect diagrams - flowcharts - check sheets -pareto diagrams - histograms -control charts - scatter diagrams |
|
|
|
Cause and effect diagrams |
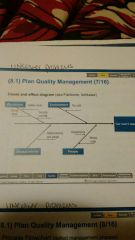
Fishbone, ishikawa diagram. Take a problem, then go through potential problems. Cause and effect diagram |
|
|
|
Quality process flow chart |
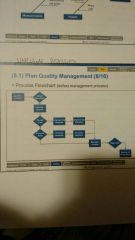
Defect management process. Graphical depiction of process. |
|
|
|
Quality check sheets |
Only organized data about problems. Collects and organize dated regarding potential quality problems |
|
|
|
Pareto chart/diagram |
- histogram ordered by frequency of occurrence - only organize data about problems - 80/20 rule. Also called Pareto's law. 80% of problems come from 20% of causes |
|
|
|
Quality histograms |
It didn't showing how often each error event occurred. Only used to organize data about problems. |
|
|
|
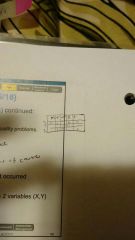
Quality scatter diagram |
Shows the relationship or correlation between two variables. Can uncover problem. |
|
|
|
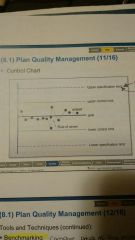
Control charts |
- control charts are used to see if quality exceeds upper and lower limits. The mean or average is the middle horizontal line. |
|
|
|
Out of control on a control chart |
When the data point Falls outside the control limits. Above the upper limit or below the lower limit. Calculated at plus or minus 3 Sigma based on the whole population |
|
|
|
Rule of seven |
On a control chart, if seven consecutive data points are plotted on the same side of the mean. Either above or below the mean, even if they are within the control limits, the project manager should investigate, because the project is out of control |
|
|
|
Project quality management tools and techniques |
- benchmarking - design of experiments (DOE) -statistical sampling -"Additional quality planning tools " |
|
|
|
Benchmarking |
Comparing actual and planned practices to those of comparable projects to identify best practices, generate ideas for improvement, and provide a basis for measuring performance. |
|
|
|
Design of experiences (DOE) |
Statistical technique that identifies the variables that will have the greatest effect on overall project outcomes. Helps determine the number and type of tests, and their impact on quality. Used to determine the number and types of tests you'll need |
|
|
|
Plan quality management statistical sampling |
Taking a small sample as a representative of the group |
|
|
|
Plan quality management additional quality planning tools |
- brainstorming - force field analysis: diagrams of forces for and against change - nominal group technique: brainstorm then rank ideas - quality management and control tools colon used to a sequence and Link the quality management activities that have been identified. |
|
|
|
Quality management and control tools |
Sequence and link quality activities together. They do not uncover any data. used to sequence and link the quality management activities that have been identified, they include: -affinity diagrams - process decision program charts - tree diagrams - prioritization matrices. A method to rank issues by importance. - activity network diagrams - matrix diagrams: pivot table showing relationships between factors, causes, and objectives |
|
|
|
plan quality management outputs |
- quality management plan - process improvement plan |
|
|
|
Quality management plan |
Explains how the project team will implement the quality policy. A how to |
|
|
|
Process improvement plan |
A subsidiary of the project management plan. It includes: - process boundaries - process configuration - process metrics - targets for improved performance |
|
|
|
Process boundaries |
Describes the purpose of processes, what it's for, they're starting end, their input / output, required data, owner, stakeholders |
|
|
|
Process configuration |
Graphical depiction of the process. Flow chart. |
|
|
|
Process metrics |
Allows analysis of process efficiency |
|
|
|
Target for improved performance |
Guides the process improvement activities |
|
|
|
Quality metrics |
Operational definitions. Describes a project attribute and how the quality control process will measure it. I.e defect frequency, failure rate, reliability. Can also measure project management success, such as schedule and cost performance. |
|
|
|
Quality checklists |
A list that ensures every step has been performed. List of steps |
|
|
|
Plan quality management project documents updates |
Stakeholder register, responsibility assignment matrix, WBS, and WBS dictionary |
|
|
|
Human resource management |
Includes the processes that organize, manage, and lead the project team |
|
|
|
Plan human resource management |
The process of identifying and documenting project roles, and responsibilities, required skills, reporting relationships, and creating a staffing management plan. |
|
|
|
Plan human resource management tools and techniques |
- organizational charts and position descriptions - networking - organizational theory |
|
|
|
Organizational charts and position descriptions |
- hierarchy type charts: show positions in a graphic, top-down format - matrix based charts: responsibility assignment matrix (RAM) is a tabular chart that shows relationships between work packages or activities and project team members. Example RACI chart |
|
|
|
Organizational theory |
Information about how people, teams, and organizational units behave |
|
|
|
Responsibility assignment matrix (RAM) |
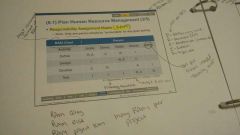
RACI chart is the most common format of RAM. Only one person should be accountable for any given item. |
|
|
|
Plan human resource management outputs |
- human resource management plan |
|
|
|
Staffing management plan |
Part of the human resource management plans. The purpose is to delineate how the traditional HR duties we performed on the project. - staff acquisition, resource calendars, staff release plans, training needs, recognition and rewards, compliance, safety. |
|
|
|
Project communications management |
Includes the process is required to ensure timely and appropriate generation, collection, distribution, storage, retrieval, and ultimate disposition of project information |
|
|
|
Plan communications management |
The process of determining the project stakeholder information needs and defining a communication approach |
|
|
|
Communication types |
-formal written: official letters, pmps, project charter, etc - informal written: email - formal verbal: presentations, speeches - informal verbal: meetings and conversations |
|
|
|
Communications tools and techniques |
- communication requirements analysis - communication technologies - communication models |
|
|
|
Communications requirements analysis |
- used to determine the information needs of a stakeholder - communication is body language mostly, then vocal inflection, then words |
|
|
|
Potential communication channels |
(N(n-1))/2 |
|
|
|
Communication technology |
Email, instant messaging, SharePoint, etc |
|
|
|
Interactive communication |
Type of communication method. Two or more parties. Example: meetings, phone calls, video conferencing |
|
|
|
Push communication |
Type of communication method. One way communication sent to specific recipient. Example: emails, voice mail, press release |
|
|
|
Pull communication |
Type of communication method. type of communication method. Self service repository. Example: SharePoint, internet sites, physical files, accessing voicemail |
|
|
|
Project risk management |
The prices of conducting risk management planning and identifying, analyzing, responding to, and controlling project risks |
|
|
|
Plan risk management |
Defines how to conduct risk management activities for the project. Sets forth a General approach for risk management. |
|
|
|
Risk |
And uncertain event or condition that, if it occurs, has a positive or negative effect on one or more project objectives. Not ambiguous. Weather is not a risk, Lightning is a risk. |
Negative risks are called threats, positive risks opportunity |
|
|
Identify risks |
The process of determining which specific risks may affect the project. Looking for actual risk events |
|
|
|
Identify risks tools and techniques |
Diagramming techniques - cause and effect diagrams (fishbone, ishikawa) - system or process flow charts (enterprise architecture diagrams) - influence diagrams (shows relationship between variables and outcomes) SWOT analysis - analyzing the strengths and weaknesses of the organization, and the ways in which they may lead to opportunities and threats. |
|
|
|
SWOT analysis |
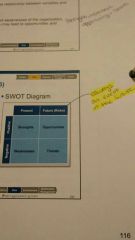
Identify risks tool and technique. Analyzing the strengths and weaknesses of the organization, and the ways in which they may lead to opportunities and threats. |
|
|
|
Black swan |
Extremely low probability event with extremely high consequences. Positive or negative. Powerball, 9-11, Chernobyl |
|
|
|
Perform qualitative risk analysis |
The process of prioritizing risks for further analysis or action by addressing their combined probability of occurrence and impact. |
|
|
|
Perform qualitative risk analysis tools and techniques |
- risk probability and impact assessment -probability and impact matrix -risk data quality assessment -risk categorization -risk urgency assessment |
|
|
|
Risk probability and impact assessment |
Investigates likelihood of risk occurrence and impact |
|
|
|
Probability and impact matrix |
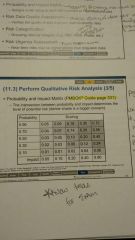
Assigns a risk rating to each risk (numeric or high/medium/low). Looking at the chance the risk would occur.. Low might be on watch list, medium and high will have response plan. |
|
|
|
Perform quantitative risk analysis |
The process of numerically analyzing the effect of identified risks on the overall project objectives. |
|
|
|
Perform quantitative risk analysis tools and techniques |
-data gathering and representation techniques - quantitative risk analysis and modeling techniques |
|
|
|
Data gathering and representation techniques |
Part of Quantitative risk analysis. Interviewing and probability distributions |
|
|
|
Quantitative risk analysis and modeling techniques |
- sensitivity analysis: analyzes which variable have the greatest impact on the project. Results are graphically shown as a tornado diagram. -expected monetary value analysis. EVM= probability*impact -decision tree- using EVM to make a decision. -modeling and simulation ( Monte Carlo analysis) |
|
|
|
Tornado diagram |
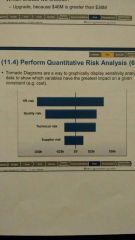
A way to graphically display sensitivity analysis days to show which variables have the greatest impact on a given constraint (eg. Cost) |
|
|
|
Plan risk response |
The process of developing options and actions to enhance opportunities and reduce threats. Where we come up with specific response plan |
|
|
|
Strategies for threats |
Plan risk response tool and technique. *avoid- eliminate threat *transfer- shift rush to third party *mitigate- reduce probability of it occurring or impact of it does * accept- live with the risk (active acceptance involved contingency) |
|
|
|
Strategies for opportunities |
*exploit- change something to ensure it occurs *share- teaming * enhance- increase probability and positive impacts *accept- not pursuing it |
|
|
|
Contingency plan |
A planned risk response that's implemented in response to a particular event occurring |
|
|
|
Fallback plan |
Plan b. And alternative set of actions and tasks available in the event that the primary plan needs to be abandoned because of issues, risks, or other causes |
|
|
|
Residual risk |
A risk that remains after risk responses have been implemented |
|
|
|
Secondary risk |
A risk that arises as a direct result of implementing a risk response (spin off risk) |
|
|
|
Contingency reserves |
Known unknowns. These are for risks that can be foreseen. Contingency reserves cab be derived for both time and cost. They become part of the schedule and cost baseline and are owned by the PM. |
|
|
|
Management reserves |
These are for unforeseeable risks to the entire project and cab be derived for both time and cost. They are not included in the schedule or cost baseline and are owned by management. PM must get approval prior to using these. |
|
|
|
Project procurement management |
Process necessary to purchase and acquire products, services, it results from outside the project team |
|
|
|
Plan procurement management |
The process of documenting project purchasing decisions, specifying the approach, and identifying potential sellers. No contracts. |
|
|
|
Single source |
Choosing a seller/vendor without competition, perhaps because of a prior business relationship |
|
|
|
Sole source |
Choosing a seller because it is the only source of the required product or service. |
|
|
|
Tender |
Often used interchangeably with bid |
|
|
|
Privity |
Signifies a contractual relationship between two parties |
|
|
|
Force majeure |
A contact clause allowing for nonperformance when unforeseeable and uncontrollable events occur (natural disasters, riots etc) |
|
|
|
Fait accompli |
Terms and conditions are non negotiable |
|
|
|
Contact types |
-Fixed price contacts ( need very clear SOW) - cost reimbursable contacts (used when cab only describe end product) -time and materials |
|
|
|
FFP |
Firm fixed price |
|
|
|
FPIF |
Fixed price incentive fee |
|
|
|
FP-EPA |
Fixed price economic price adjustment. When performed over many years. |
|
|
|
CPFF |
Cost plus percentage of cost |
|
|
|
CPFF |
Cost plus fixed fee. Paid at end |
|
|
|
CPIF |
Cost plus incentive fee. |
|
|
|
CPAF |
Cost plus award fee. Buyer makes award decision by themselves. Seller can't file claim if doesn't get award. |
|
|
|
Relative risks amongst contact types |
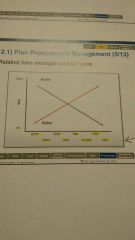
Riskiest to buyer: CPPC, CPFF, CPAF, CPIF, TM, FPEPA, FPIF, FFP |
|
|
|
Point of total assumption |
The point where the seller has to pay for all cost overruns. FPIF contacts.
- costs are shared in a predetermined ratio between the buyer and seller. - when the point of total assumption is reached, the buyer will stop contributing to the costs. PTA= ((ceiling price-target price)/buyers share ratio)+target cost
|
|
|
|
Ceiling price |
Cost of total assumption term. FPIF. Maximum price the buyer agrees to pay. |
|
|
|
Target cost |
Point of total assumption term. FPIF. Initially negotiated figure estimated contract costs. FP |
|
|
|
Target profit or fee |
Point of total assumption term. FPIF. The initially negotiated profit. IF. |
|
|
|
Target price |
Point of total assumption term. FPIF. Target cost plus target profit. FPIF |
|
|
|
Share ratio |
Point of total assumption term. FPIF. The ratio used to determine how under-runs or overruns increase our decrease profit. |
|
|
|
Make or buy analysis |
Deciding whether work should be performed in house by the team or if it should be procured. The analysis should consider all related costs, both direct and indirect. |
|
|
|
Market research |
Examining industry and specific vendor capabilities. Teams may leverage information from conferences, review, and other sources to identify market capabilities. Internet, talk to vendors, customers, conferences |
|
|
|
Procurement documents |
- request for information -invitation for bid - request for proposal |
|
|
|
Request for information |
Preliminary request to evaluate then for bid. A formal request for preliminary information for the purpose of evaluating potential bids for services |
|
|
|
Invitation for bid |
An invitation to contractors to submit a proposal on a specific project. Generally the same thing as request for quote. The IFB or RFQ is generally focused on pricing alone, and not ideas or concepts |
|
|
|
Request for proposal |
A RFP informs vendors of customer needs and expectations. Organized typically into three areas: technical, administrative, and financial requirements. Typically used for more complex technical solutions |
|
|
|
Elements of a contract |
Offer, acceptance, capacity, consideration, and legal purpose |
|