![]()
![]()
![]()
Use LEFT and RIGHT arrow keys to navigate between flashcards;
Use UP and DOWN arrow keys to flip the card;
H to show hint;
A reads text to speech;
14 Cards in this Set
- Front
- Back
|
Reasons to hold Inventory |
1. Speculation: get good prices for bulk shipments 2. Decoupling: preventing stations from starvation/blocking 3. Pre-Building: preparing for peak demands 4. Filling supply pipelines: new product launch |
|
|
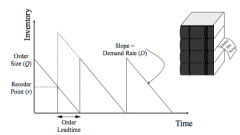
Ideal Inventory-Time Chart |
|
|
|
Inventory Costs |
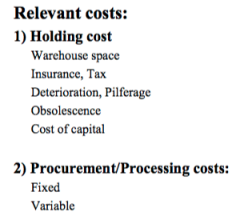
Obsolescence & Cost of Capital - Talk to Fin Dept (if someone says holding costs are 10-15%, he is not accounting for the opp.cost) Normal: 25% Max:40% Pilferage: 1,5-3% |
|
|
Procurement costs per year |
=(D/Q)*(S+cQ) = DS/Q + Dc Q - quantity of inventory (in a single order) D - demand per year S - cost of placing a single order to supplier c - inventory unit production cost |
|
|
Holding costs per year |
=(h+ic)*(Q/2)=H*Q/2 h - physical holding costs (warehousing/op.cost) i - annual opportunity cost of capital (ex: 20% if invested othrwise) c - inventory unit production cost H - all holding costs |
|
|
Total inventory costs per year |
DS/Q+Dc+HQ/2 D - demand per year S - cost of placing a single order to supplier Q - quantity of inventory (in a single order) c - inventory unit production cost H - all holding costs |
|
|
EOQ |
Economic Order Quantity=SQRT(2DS/H) D - demand per year S - cost of placing a single order to supplier H - all holding costs |
|
|
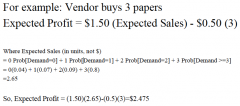
Newspaper Demand Forecasting Cost 0,5; Gain 1,5; Probabilities; 3 newspapers |
|
|
|
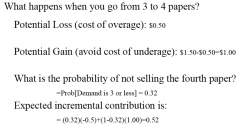
Marginal Analysis Newspaper 1 Cost 0,5; Gain 1,5; Probabilities; 4 newspapers |
|
|
|
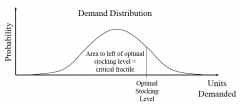
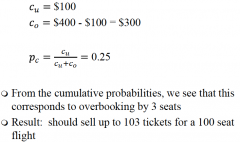
Critical Fractile |
Pc = Cu/(Cu+Co) Pc - probability of CritFr Cu - Underage Cost (Gain) Co - Overage Cost (Loss) Pc - area to the left of the optimal stocking level on the bell curve |
|
|
Expected incremental contribution of additional unit "n" !!! |
=(Cumulative P of n-1)*(- unit cost) + (1- Cumulative P of n-1)*(unit rev - unit cost) |
|
|
Critical Fractile Graphically |
|
|
|
|
|
|
|