![]()
![]()
![]()
Use LEFT and RIGHT arrow keys to navigate between flashcards;
Use UP and DOWN arrow keys to flip the card;
H to show hint;
A reads text to speech;
59 Cards in this Set
- Front
- Back
|
Market |
Where buyers and sellers meet to trade or exchange goods and services. |
|
|
How do markets allocate scarce resources? (i.e. how do markets answer the Basic Economic Problem?) |
Through the price mechanism where market forces dictate what products are exchanged and the quantity in which a product is demanded or supplied. |
|
|
Demand |
The quantity of a good or service that consumers are willing and able to buy at a given price over a given time period. |
|
|
How can demand be subdivided? |
Notional demand: how much of a good or service that people want. Effective demand: how much of a good or service people are actually willing and able to buy. |
|
|
Ceteris paribus |
Latin for "other things being equal"; the assumption that other variables remain unchanged when a shift in market forces occurs. Normally refers to the effect of a change in price on the market. |
|
|
What is the relationship between price and quantity demanded? |

The Normal Law of Demand states that there is an inverse relationship between price and quantity demanded: if a price falls, people will be more willing and able to buy a product so quantity demanded will rise (an extension of demand); if a price rises, quantity demanded will fall (a contraction of demand). |
|
|
Demand schedule |
The data on quantity demanded at different prices that is used to draw a demand curve. |
|
|
PASIFIC |
The non-price determinants of demand. They cause a shift of the demand curve. Population changes: more/less people to buy products. Advertising: advertising campaigns will increase demand. Substitutes: the number and price of substitutes affects demand. Income: more/less money = more/less willing and able to buy. Fashion & taste: products that are in fashion have higher demand. Interest rates: lower rates = cheaper borrowing = higher demand. Complements: the price of which affects demand. |
|
|
What is the effect of a change in the determinants of demand? |
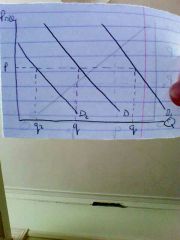
D1 is a result of a change that increases demand while D2 is the result of a change that decreases demand. These changes shift the demand curve and thus change quantity demanded. However, price remains the same. |
|
|
Normal good |
A good that obeys the Normal Law of Demand and one for which demand increases with income. |
|
|
Veblen good |

Non-normal type of good theorised by Thorstein Veblen. It's an example of conspicuous consumption (consumption to be noticed). Once a good reaches the "snob value", demand begins yo rise with price as purchase begins to confer special status onto the consumer. An example of this is the demand for Rolls Royce cars. This applies more to individuals than entire markets. |
|
|
Inferior goods |
Goods that do not obey the Normal Law of Demand in that, as income increases, quantity demanded decreases, as opposed to increasing. This is because consumers who get more income move away from inferior goods to normal goods of better quality. Examples are public transport or value range food products. |
|
|
Giffen goods |
Goods that are so basic and necessary for survival that, when prices rise, demand too rises, financed by reduced expenditure on other goods. An example was potatoes during the Irish Famine. Giffen goods only exist in extreme poverty and are also inferior goods. |
|
|
Types of demand |
Joint/Complementary Demand: demand for goods that are used together e.g. petrol and cars Alternative/Competitive Demand: demand for goods that serve as substitutes to one another. Some are closer substitutes (e.g. Pepsi and Coke) while some are less close (e.g. tablet computers and calculators) Derived Demand: demand for a product that arises from the demand for another e.g. the demand for bricks arises from the demand for buildings Composite Demand: demand for a product with multiple uses e.g. paper for writing on and making origami models |
|
|
Consumer surplus |

The difference between what a consumer is willing to pay for a product and how much that they actually pay i.e. the price. The surplus is considered a benefit to the consumer, as it's money they were prepared to spend but then didn't have to. |
|
|
Supply |
The quantity that suppliers are willing and able to provide at a given price over a given time period. |
|
|
What is the relationship between price and supply? |

Higher price increases supply because of the profit motivation; increased price means more revenue per unit so more profit. This, once again assumes ceteris paribus and this information comes from a supply schedule. |
|
|
PINTS WC |
The non-price determinants of supply. They cause movements of the supply curve. Productivity: output per worker over a time period. Indirect taxes: increase costs of production so reduces supply. Number of firms: more sellers in a market = more supply. Technology: affects productivity. Subsidies: reduce costs of production so increase supply. Weather: can affect supply e.g. of agricultural goods. Costs of production: higher = less supply, lower = more supply. |
|
|
How can you tell the value of a tax or subsidy from a supply diagram? |
The vertical difference between two supply curves is equal to the value of the tax/subsidy. |
|
|
Different types of supply |
Alternate Supply: if the price of one good falls, the supply of another will rise as resources are transferred into it e.g. wheat and barley.
Joint Supply: some things are supplied together e.g. the supply of leather and the supply of beef will rise together. |
|
|
Producer surplus |

|
|
|
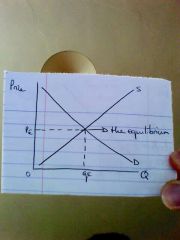
Market equilibrium |
|
|
|
What happens if the price is set above the equilibrium? |

|
|
|
What happens if price is set below the equilibrium? |

|
|
|
Why is the market equilibrium preferred? |
It's where the most profits are made while satisfying the most demand, therefore there is always an incentive for firms to keep their prices there. |
|
|
What is the 'invisible hand'? |
It links producers and consumers within the market through the price system. Adam Smith theorised that, as long as producers maximise profits and consumers maximise utilities, resources will be allocated efficiently. |
|
|
ARSI |
The functions of the price mechanism Allocates resources efficiently Rations excess supply and demand by sending Signals of what will happen and giving Incentives to firms and individuals to meet equilibria |
|
|
How can the position of the equilibrium change? |
By a shift in either supply or demand or both. |
|
|
Price elasticity of demand |
The responsiveness of quantity demanded to a change in price. PED = %∆ in qdd/%∆ in price |
|
|
What is the implication of price elasticity of demand being greater than 1? |

|
|
|
What is the implication of price elasticity of demand being smaller than one? |

|
|
|
What is the significance of price elasticity of demand being 0, 1 or Ø? |
0 = perfectly inelastic; quantity demanded will not change regardless of price; the curve will be vertical. ∅ = perfectly elastic; quantity demanded can be anything for the one price; the curve will be horizontal. 1 = unit elasticity; quantity demanded and price will change at the same rate; the curve will be a rectangular hyperbola. |
|
|
What are the implications of price elasticity of demand being positive or negative? |
Most goods will be negative due to the inverse relationship between price and quantity demanded. Veblen and Giffen goods, however, may have positive values. |
|
|
What kinds of factors determine PED? |
Availability and closeness of substitutes: if there are lots of substitutes that are really similar to a good, it will have a more elastic PED as people will be more likely to jump to them as a result of a price rise e.g. different brands of baked beans. What proportion of income that that good takes up: if a good is a small proportion of someone's income, a change in price will not effect them much therefore PED may be more inelastic. However, if that spending is a large proportion of income, the effect will be greater so it may be more elastic. An exception to this is things like food or habit forming goods which are necessities therefore PED may still be inelastic. Time: in the short term, it is harder for consumers to change their spending habits so initially PEDs can be inelastic. However, over time, once people have had time to review spending and find substitutes, they may be more likely to make different choices, making PED more elastic. |
|
|
Income elasticity of demand |
The responsiveness of quantity demanded to a change in income. YED = %∆ in qdd/%∆ in Y |
|
|
What is the significance of YED being positive or negative? |
Positive: normal good, as demand increases with income.
Negative: inferior good, as demand decreases when income rises because people have money to spend on other, better things. |
|
|
If a normal good is income elastic, what is it likely to be? |
A desirable, luxury good. |
|
|
Superior good |
A good with a relatively large YED. They are the kind of good that people are eager to buy when they get extra income e.g. holidays and other indulgences. |
|
|
What does the income/quantity demanded curve look like when YED is elastic/inelastic etc? |
Elastic: shallow gradient Inelastic: steep gradient Unit elastic: gradient of 1 Perfectly inelastic: vertical Perfectly elastic: horizontal Inferior good: negative gradient |
|
|
Cross elasticity of demand |
The responsiveness of quantity demanded for one good to a change in price of another. XED = %∆ in qdd of good A/%∆ in price of good B |
|
|
What is the significance of XED being positive or negative or zero? |
Positive: substitutes as an increase in the price of one leads to an increase in the other's qdd. Negative: complements as their prices and demanded quantities relate the same as they would if they were the same good. Zero: the two goods are not related. |
|
|
What do the sizes of XED values represent? |
The larger the value is, the closer the relationship between them. The more elastic the XED of substitutes, the easier it is for consumers to jump between the two. When they are more inelastic, moving between is less easy as they do not substitute as closely. |
|
|
Price elasticity of supply |
The responsiveness of quantity supplied to a change in price. PES = %∆ in qsd/%∆ in price |
|
|
What will the supply curve look like if PES > 1? |
Supply will be price elastic. Here, the curve will be a straight line that cuts the y-axis. |
|
|
What will the supply curve look like if PES < 1? |
Supply will be inelastic and the curve will be a straight line that cuts the x-axis. |
|
|
What will the supply curve looks like if PES = 1? |
Supply will have unit elasticity and the curve will be a straight lime through the origin. |
|
|
What factors effect elasticity of supply? |
Ability to hold stock: if stock can easily be held, firms can reduce qsd when prices fall. Similarly, if stock is held when the price rises, the firm can quickly put up that stock for sale. However, holding stock is affected by whether the space is available and how perishable the goods are. Availability and mobility of factors of production: if factors are available, qsd can be easily increased, and mobile factors can easily be moved from the production of one product to that of another. Spare capacity: where a firm has spare capacity, this can easily be employed when necessary to boost qsd. Time: in the short term, supply will be more inelastic as it takes time to respond to a change in price however, in the longer term, supply generally becomes more elastic. This varies for dissent products depending on how long it takes to up production e.g. increasing production of meat requires new livestock top be grown. |
|
|
How could elasticity data be collected? |
Customer surveys (PED and YED), company records (PES) and analysis of competitors (XED) |
|
|
What has to be considered when looking at elasticity measurements? |
They are estimates and may have errors in data collection. Getting data for a full range of price changes can be difficult, especially over time. There are other factors that may affect qdd in reality, therefore it may not be the elasticity factor that's causing the change. |
|
|
What is the business relevance of PED to a firm? |
It helps develop their pricing strategy. If demand is elastic, it may benefit the firm to reduce their prices, as then qdd will increase more than price fell so there will be an overall increase in revenue. However, firms would have to consider the impact of a higher qdd on their costs; if costs rise more than revenue, they will lose profits which is not a good strategy. If demand is price inelastic, firms will generally benefit from raising prices as qdd will fall less than prices rise, so there will be an overall gain in revenue and profits. This is why inelastic goods such as the tickets needed to commute up London often cost more than their elastic counterparts. |
|
|
What is the relevance of PED to the government? |
When setting indirect taxes, the government may select price inelastic goods as qdd will not fall dramatically therefore the government will gain tax revenue. Taxing elastic goods, on the other hand, will lead to a dramatic fall in qdd, not boosting tax revenue as much however this will reduce consumption of the good. |
|
|
What is the business relevance of YED to a firm? |
It can be used, along with economic forecasts, to predict future demand and plan changes in supply or production decisions. For example, if a recession is expected, when incomes will likely fall, firms will know to expect falls in demand for income elastic normal/superior goods but rises in demand for inferior goods. |
|
|
What is the business relevance of XED to a firm? |
Where goods are substitute goods in a competitive market, as will be shown by their XED, firms will know that increasing their price is dangerous as they will quickly lose out to their competitors. Similarly, they will know that reducing prices will likely help them win customers from competitors, though brand loyalty can make this difficult. If goods are complementary, the implications of XED may not be as obvious. If the price of a DVD recorder falls, the demand for recordable DVDs may not change much did top the vast gap in the process of the two products and the fact that other factors effect the demand for the DVDs (e.g. need to record things). XED may be linked to goods that are offered together in a deal. |
|
|
What is the business relevance of PES to a firm? |
For almost all firms, elastic supply is desirable. If supply is inelastic (as it normally is in the short term), firms may hold stock if possible in order to increase their ability to respond to future price changes. In the long term, supply is generally elastic, however a firm would want to be able to quickly respond to a price change in order to capitalise on potential new revenue. |
|
|
Productive efficiency |
Where the maximum output is produced using a finite set of resources. This is production on the PPC. |
|
|
Technical efficiency |
Where the most advanced techniques are used to ensure productive efficiency. |
|
|
Allocative efficiency |
Where consumer satisfaction is maximised with all the goods and services that they want being produced. This is also where the cost of producing a good equals its market price i.e. the market is in equilibrium. |
|
|
Economic efficiency |
Where both allocative and productive efficiency are satisfied. E.g. in a society of vegetarians, though it is productively efficient to produce the maximum output of meat with the available resources however that is not allocatively efficient as meat is not desired in society therefore it is an economically inefficient allocations allocation of resources. |
|
|
Pareto efficiency |
Where it is not possible to make a person better off without making another worse off. This is production on the PPC. Production within the PPC is pareto inefficient and moving closer to the PPC is a pareto improvement. |