![]()
![]()
![]()
Use LEFT and RIGHT arrow keys to navigate between flashcards;
Use UP and DOWN arrow keys to flip the card;
H to show hint;
A reads text to speech;
40 Cards in this Set
- Front
- Back
|
Rational |
Economic agents are able to consider the outcome of their choices and recognise the net benefits of each one. Rational agents will select the choice which presents the highest benefits. |
|
|
Demand |
The amount of a good/service that a consumer is willing and able to purchase at a given price in a given time period |
|
|
Effective Demand |
If a consumer is willing to purchase a good, but cannot afford to. |
|
|
Factors that shift Demand Curves |
Changes in real incomes, changes in taste/fashion, advertising, changes in the price of a subsitute, changes in the prices of complmentary goods. |
|
|
Marginal Utility |
The additional utility (satisfaction) gained from the consumption of an additional product |
|
|
The Law of Diminishing Marginal Utility |
As additional products are consumed, the utility gained from the next unit is lower than the utility gained from the previous unit. |
|
|
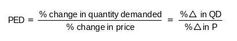
Price Elasticity of Demand (PED) |
Determines how responsive the change in quantity demanded is to a change in price. |
|
|
Calculation of PED |
|
|
|
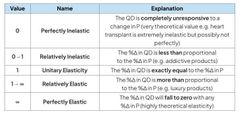
Interpreting PED Values |
|
|
|
Factors that influence the PED |
Availability of subsitutes, addictiveness of the product, % of income, time period, |
|
|
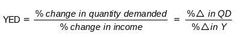
Calculation of YED |
|
|
|
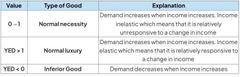
Interpreting YED Values |
|
|
|
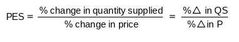
Calculation of PES |
|
|
|
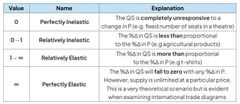
Interpreting PES Values |
|
|
|
Factors that influence the PES |
Mobility of the factors of production, availability of raw materials, ability to store goods, spare capacity, time period |
|
|
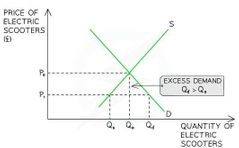
Disequilibrium - Excess Demand Graph |
|
|
|
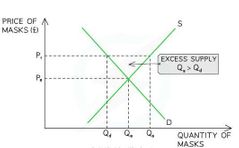
Disequilibrium - Excess Supply Graph |
|
|
|
The Price Mechanism |
The interaction of demand and supply in a free market, this interaction determines prices which are the means by which scarce resources are allocated between competing wants/needs. |
|
|
Rationing (Price Mechanism) |
Prices allocate (ration) scarce resources. When resources become scarcer the price will rise further. Only those who can afford to pay for them will receive them. |
|
|
Signalling (Price Mechanism) |
Prices provide information to producers & consumers where resources are required (in markets where prices increase). |
|
|
Incentive (Price Mechanism) |
When prices for a good/service rise, it incentivises producers to reallocate resources from a less profitable market to this market in order to maximise their profits. |
|
|
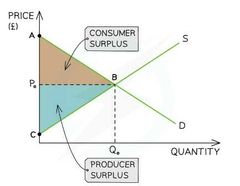
Consumer Surplus |
The difference between the amount the consumer is willing to pay for a product and the price they have actually paid. |
|
|
Producer Surplus |
The difference between the amount that the producer is willing to sell a product for and the price they actually do. |
|
|
Consumer/Producer Surplus Graph |
|
|
|
Indirect Tax |
Paid on the consumption of goods/services, it is only paid if consumers make a purchase. |
|
|
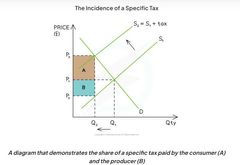
Specific (Indirect Tax) |
A fixed tax per unit of output (specific amount) |
|
|
Ad Valorem (Indirect Tax) |
A tax that is a percentage of the purchase price e.g VAT |
|
|
The Incidence of a Specific Tax |
|
|
|
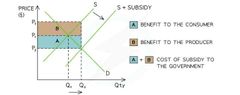
Subsidies |
A per unit amount of money given to a firm by the government to increase production |
|
|
The Incidence of Subsidies |
|
|
|
Factors that influence YED |
Recession, minimum wage legislation, taxation, increased international trade |
|
|
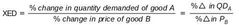
Cross Price Elasticity of Demand (XED) |
Reveals how responsive the change in quantity demanded for good A is to a change in price of good B. |
|
|
Calculation of XED |
|
|
|
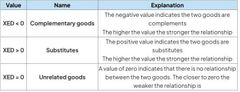
Interpreting XED Values |
|
|
|
The Revenue Rule of PED |
The total revenue rule states that in order to maximise revenue, firms should increase the price of products that are inelastic in demand and decrease prices on products that are elastic in demand |
|
|
Supply |
The amount of a good/service that a producer is willing and able to supply at a given price in a given time period |
|
|
Factors that shift Supply Curves |
Cost of production, indirect taxes, subsidies, new technology. |
|
|
Price Elasticity of Supply (PES) |
Reveals how responsive the change in quantity supplied is to a change in price |
|
|
Factors that affect a Consumers Rational Behaviour |
Influence of others behaviour (peer pressure, Advertisement), Habitual nature( Consumer inertia, Addictive products), Consumer weakness at computation (too much choice, time period and even shelving placement). |
|
|
Consumer Inertia |
The tendency for consumers to continue buying a product despite superior options exisisting e.g Broadband account. |