![]()
![]()
![]()
Use LEFT and RIGHT arrow keys to navigate between flashcards;
Use UP and DOWN arrow keys to flip the card;
H to show hint;
A reads text to speech;
29 Cards in this Set
- Front
- Back
|
Scenario 1: The supply of aged cheddar cheese is inelastic, and the supply of bread is elastic. Both goods are considered to be normal goods by a majority of consumers. Suppose that a large income tax increase decreases the demand for both goods by 10%. The equilibrium quantity will _______________. |
decrease in the aged cheddar cheese market and decrease in the bread market |
|
|
Scenario 1: The supply of aged cheddar cheese is inelastic, and the supply of bread is elastic. Both goods are considered to be normal goods by a majority of consumers. Suppose that a large income tax increase decreases the demand for both goods by 10%. The equilibrium price will _______________. |
decrease in the aged cheddar cheese market and decrease in the bread market |
|
|
When a good is taxed, _______________. |
both buyers and sellers of the good are made worse off |
|
|
When a tax is imposed on the buyers of a good, the demand curve shifts _______________. |
downward by the amount of the tax |
|
|
A tax on a good _______________. |
gives sellers an incentive to produce less of the good than they otherwise would produce |
|

Refer to Figure 1. The vertical distance between points A and B represents a tax in the market. The imposition of the tax causes the quantity sold to __________.
|
decrease by 1 unit |
|
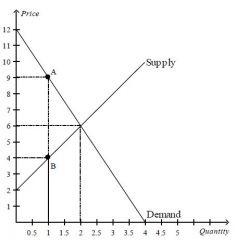
Refer to Figure 1. The vertical distance between points A and B represents a tax in the market. The amount of the tax on each unit of the good is ____.
|
$5 |
|

Refer to Figure 1. The vertical distance between points A and B represents a tax in the market. The amount of tax revenue received by the government is _____.
|
$5 |
|

Refer to Figure 1. The vertical distance between points A and B represents a tax in the market. The loss of consumer surplus associated with some buyers dropping out of the market as a result of the tax is _____. |
$1.50 |
|

Refer to Figure 1. The vertical distance between points A and B represents a tax in the market. The loss of consumer surplus for those buyers of the good who continue to buy it after the tax is imposed is _____.
|
$3.00 |
|
|
Sellers of a product will bear the larger part of the tax burden, and buyers will bear a smaller part of the tax burden, when the _______________.
|
demand for the product is more elastic than the supply of the product |
|
|
The deadweight loss from a $3 tax will be largest in a market with _______________. |
elastic supply and elastic demand |
|
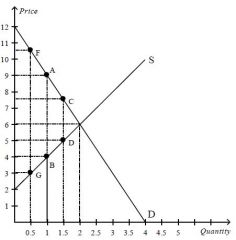
Refer to Figure 2. The original tax can be represented by the vertical distance AB. Suppose the government is deciding whether to lower the tax to CD or raise it to FG. Which of the following statements is correct?
|
Compared to the original tax, the larger tax will decrease tax revenue and increase deadweight loss. |
|
|
If the supply of land is perfectly inelastic, the burden of a tax on land falls _______________.
|
entirely on landowners |
|
|
When the government imposes taxes on buyers or sellers of a good, society _______________. |
loses some of the benefits of market efficiency |
|
|
When a tax is imposed on a good for which the supply is relatively elastic and the demand is relatively inelastic, _______________. |
buyers of the good will bear most of the burden of the tax |
|
|
An economy’s production possibilities frontier is also its consumption possibilities frontier _______________. |
when the economy is self-sufficient |
|

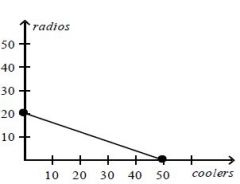
Refer to the Table 1. Assume that Aruba and Iceland can switch between producing coolers and producing radios at a constant rate. Which of the following represents Aruba's production possibilities frontier when 100 labor hours are available?
|
|
|

Refer to Table 1. Aruba has an absolute advantage in the production of _______________.
|
neither good and Iceland has an absolute advantage in the production of both goods |
|

Refer to Table 1. Aruba has a comparative advantage in the production of _______________.
|
radios and Iceland has a comparative advantage in the production of coolers |
|
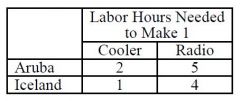
Refer to Table 1. At which of the following prices would both Aruba and Iceland gain from trade with each other? |
2 radio for 6 coolers |
|

Refer to Figure 3. If country A chooses to trade, _______________.
|
Country A’s domestic producers of baskets would be better off |
|

Refer to Figure 3. If country A chooses to trade, _______________.
|
Country A’s total surplus would increase |
|
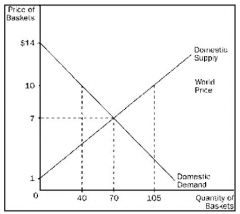
Refer to Figure 3. If country A chooses to trade, the price of baskets in country A will be _______________.
|
$10 and 40 baskets will be sold domestically |
|

Refer to Figure 3. As a result of trade, total surplus in country A increases by ________.
|
$97.50 |
|

Refer to Figure 3. Country A ________________.
|
is a price taker in the world economy |
|

Refer to Figure 3. Country A ________________.
|
should export baskets |
|
|
Mexico is relatively labor-abundant when compared with the US. Therefore, compared to the US, Mexico has a comparative advantage in ________________. |
goods that are labor-intensive in production |
|
|
Import protections are often imposed because ________________. |
groups representing import-competing industries are more cohesive than consumers |