![]()
![]()
![]()
Use LEFT and RIGHT arrow keys to navigate between flashcards;
Use UP and DOWN arrow keys to flip the card;
H to show hint;
A reads text to speech;
20 Cards in this Set
- Front
- Back
|
Angles on a straight line. |
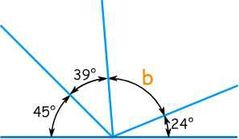
On a straight line the total of all angles are 180. |
|
|
Angles at a point. |
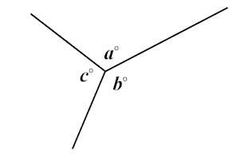
When all lines meet at a point, the angles must add to 360. |
|
|
Vertically opposite angles |
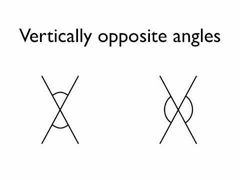
When straight lines cross, the opposing angles are equal. |
|
|
Angles sum *triangle* |
The interior angles of a triangle add up to 180. |
|
|
Corresponding angles // lines |
Corresponding angles on parallel lines are equal. |
|
|
Co interior angles // lines |
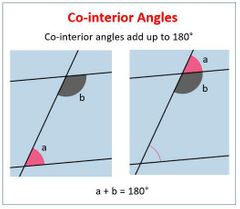
Co interior angles on parallel lines equal 180. |
|
|
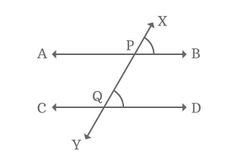
Alternate angles // lines |
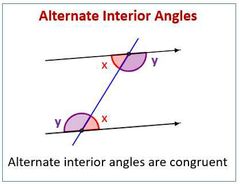
Alternate angles on parallel lines are equal. |
|
|
Angle sum polygon |
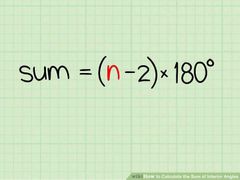
The formula to work out the interior angles of any polygon is ( n x 2 ) x 180 n = number of sides. |
|
|
Complimentary angles. |
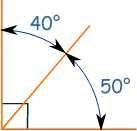
Complementary angles equal 90 degrees. |
|
|
Supplementary angles. |
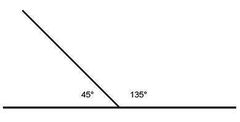
Supplementary angles add up to 180. |
|
|
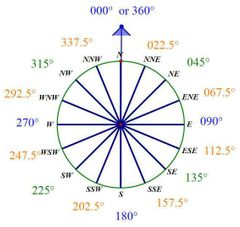
Bearings |
|
|
|
OSEM Statements - Measurement |
O means obvious, what you will write about.
S means specific, context, who? what?
E means evidence, numbers and proof.
M means meaning, so what? + Add clusters, outliers, medians and shape. |
|
|
Conclusion - Measurement |
Answer the question with supporting evidence - because.
+link to hypothesis +Reflect back if its what you expected. |
|
|
PPDAC - Measurement |
This is how we lay out out data. P means pose question. I wonder if... + hypothesis P means plan. I am going to... D means data A means analysis. graphs, statistics, OSEMS... C means conclusion. |
|
|
Even distribution - Measurement |
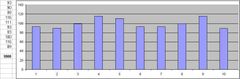
This is when the data is spread out fairly even. |
|
|
Normal distribution - Measurement |
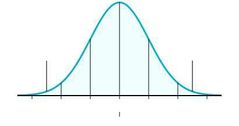
This is a symmetrical distribution with a cluster at the centre. |
|
|
Skewed distribution with tail to the right - Statistics |
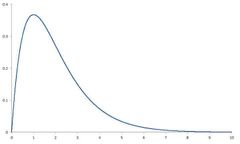
|
|
|
Skewed distribution with tail to the left - Statistics |
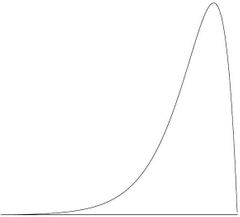
|
|
|
Cluster |
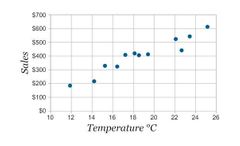
A cluster is a group of numbers objects or information located close together. In the picture above, the cluster is around 18 °c |
|
|
Outlier |
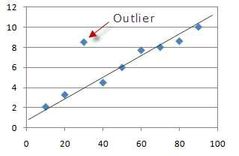
As you can see in the picture, an outlier is the number that stands out within data. |