![]()
![]()
![]()
Use LEFT and RIGHT arrow keys to navigate between flashcards;
Use UP and DOWN arrow keys to flip the card;
H to show hint;
A reads text to speech;
25 Cards in this Set
- Front
- Back
- 3rd side (hint)
|
sales potential vs market potential |
market potential = prospective volume of a specific good/service that would be bought by a defined customer over a specific amount of time n a defined geographic area and marketing environment given a defined mix of industry and marketing effort sales potential = prospective proportion of market potential for a service/good that could be purchased from a specific seller |
market potential = what consumer & organizational markets could buy from all sellers sales potential = what consumers & organizational markets could buy from one seller |
|
|
forecast |
forecast = seller's projection of market or sales potential stated in $ |
|
|
|
market share |
market share = the percentage of market share that the seller actually gets |
|
|
|
how market/Sales potential forecasting helps marketers |
monitor external environment establish realistic sales and profit objectives allocate resources to achieve these objectives control marketing efforts |
|
|
|
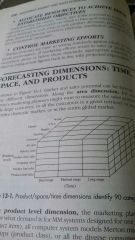
Forecasting dimensions |
area dimensions - sales potential among various customers in different territories/areas product level dimension - demand for different products time level dimension - product & area forecasts over different time periods |
|
|
|
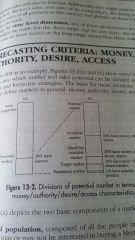
basis for deciding market and sales potential to set goals and formulate strategies |
the same as criteria that define markets in general - money - authority - desire - access |
|
|
|
two basic components of a market |
total population - composed of all people in a given country who may or may not be interested in buying the company's product
potential market - composed of people among the total population who profess some level of interest in the company's product |
|
|
|
available market |
the portion of the potential market that are interest in, can afford, and have access to the company's product |
|
|
|
qualified available market |
the portion of the potential market that have the money, desire, access, and credentials the company wants its customers to posses |
|
|
|
target market |
part of qualified available market that the company most justified cultivating |
|
|
|
penetration market |
the portion of the target market that have already purchased the company's product |
|
|
|
summary of potential market |
potential market available market qualified available market target market penetrated market |
|
|
|
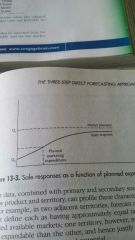
market minimum |
sales volume when marketing expenditures is $0 |
|
|
|
marketing sensitivity of demand |
difference between market minimum and market potential if distance is great, market is capable of greater growth and will be more like to respond to marketing expenditures |
|
|
|
forecast approaches |
quantitative techniques - rely on sales volume and other numbers - ^ numbers created in past and assumed to have predictive value
judgemental techniques - rely on judgement of people who have special knowledge on impact of different variables on sales |
|
|
|
quantitative techniques |
inpout-output analysis - shows resources used by different industries and industry interdependence - steel production (output) of a steel mill is an input for car manufacturers
correlation analysis - measures association between potential sales and a market factor - market factor is a measurement of economic activity called a leading factor
market factor index - used as a check on correlation analysis - develop data an overall product sales potential
chain ratio - multiply a base number (like total # of buyers) by various qualifying criteria that remind the age number to reflect pertinent characteristics of submarkets
total market demand - multiplies total number of buyers (n) by the quantity purchased by the average buyer (q) by the price of an average unit (p) to find total market demand (Q) |
|
|
|
buying power index |
published by Sales and Marketing Managemet magazine & Survey in its Survey of Buying Power |
|
|
|
formula for buying power |
Bi = 0.5Yi + 0.3Ri + 0.2Pi B = buying power Y = area's share of national disposable personal income R = area's share of national retail sales P = area's share of national population |
|
|
|
correlation analysis |
measures: degree of association between potential sales and a leading series (market factor) coefficients of income elasticity production growth trends 2 major limitations to correlation analysis 1) they require lengthy sales history to develop relationships (at least 20 quarters of sales records 2) the are expensive and time consuming. Also need databases beyond the skills of researchers |
|
|
|
organizational market forecasting strategies |
market buildup - building up total potential figures for an entire trading area by adding potential figures for specific industries in the area - SIC categories helpful time series analysis - assumes changes in sales levels in previous periods can be used to product sales in the future exponential smoothing - uses weighted average of past observations, with more weight on more recent observations - solves problem in time series analysis (assumption that future trends will continue like the past) |
|
|
|
time series analysis |
changes in sales prediction reflect 4 components: long-term treat (T) - reflecting underlying sales pattern by fitting a straight or curved line through past sales intermediate term (C) - reflecting cyclic changes in economic or competitive activity. - depicted as a wavering changes in trend line season component (S) - reflecting any recurrent weeklu, monhly, or quarterly changes in sales patterns erratic events (E) - components reflecting unexpected events that might influence sales |
|
|
|
judgement forecasting techniques |
survey of expert opinion - can use Delphi technique (estimates of future rates were sent back to people who submitted estimates until a concensus emerges) survey of buyer intentions - can use purchase probability scale (0.0 - 1.0) (0.0 = no chance. 1.0 = certain chance) - Survey Research Center of the University of Michigan best known for caster of buyer purchase intentions composite sales force opinion - |
|
|
|
judgement forecasting in international markets |
focus group panels Delphi technique |
|
|
|
quantitative forecasting in international markets |
1) modify direct forecasting approaches
2) rely on analogy approaches to measure market variables |
|
|
|
gap analysis |
used after estimates of global/domestic sales potential are made puts ^ figures into meaningful perspective compared gaps in number of areas and taking actions based on this understanding |
|