Reading...
![]()
Play button
![]()
Play button
![]()
Use LEFT and RIGHT arrow keys to navigate between flashcards;
Use UP and DOWN arrow keys to flip the card;
H to show hint;
A reads text to speech;
65 Cards in this Set
- Front
- Back
|
Opportunity cost
|
value of the next most desired good traded for higher priority good
|
|
opportunity cost example
|
clothes or food
|
|
|
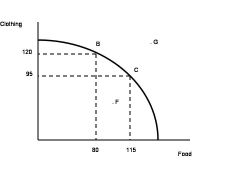
What is law of increasing opportunity cost?
What is the shape of the Curve? |
The law of increasing opportunity costs states that as production of a product increases, the cost to produce an additional unit of that product increases as well
Bowed-out |
|
|
in Constant Opportunity Costs
What is the shape of the Curve? |
Straight line
|
|
|
Characteristics of PPC
1.points inside 2.on 3.and beyond curve |
1. inefficient production
2. efficient 3. impossible with current resources or technology |
|
|
Difference in quantity demand and a change in demand
|
quantity demand is a movements along the given demand curve in response to price
change in demand is a shift in the demand curve due to changes in determinants |
|
|
Difference in quantity supplied and change in supply
|
quantity supplied is a movement along a given curve determined by price
change in supply is a shift in the supply curve when underlying factors change (costs) |
|
|
Determinants of demand
|
Taste - Desire for the good or other goods
Income Other goods - availability and price Expectations - price change, income change, taste Number of buyers |
|
|
Determinants in supply
|
Technology
Factor Cost Other goods Taxes and subsidies Expectations Number of sellers |
|
|
Law of demand
|
Quantity of a good demanded in a given time increases as the price drops
|
|
|
Law of supply
|
Quantity of a good supplied in a given time increases as the price increases
|
|
|
Surplus vs Shortage
|
Too much of a good (Prices to high)
Too little of a good (Prices to low) |
|
|
Real GDP
|
the value of final output produced in a given period, adjusted for changing prices.
The effects of price changes are removed. |
|
|
Computing Real GDP
|
Nominal GDP in year t
Real GDP in year t = ------------------------------- Price index 100 + Percentage change Price index = ------------------------------------- 100 |
|
|
Convert nominal GDP to real GDP:
|
Nominal GDP in year t
Real GDP in year t =--------------------------------- Price index Where (for 1991) Nominal GDP = $5,677.5 billion Price index = 117.8/100 or 1.178 Real GDP (1991) = $5,677.5/1.178 = $4,819.9 billion |
|
|
Calculate real GDP in terms of base year (using CPI data)
|
Nominal GDP in year t
Real GDP in year t = --------------------------------- Price index Where (for year t) Nominal GDP = $15 trillion Price index = 150/100 or 1.5 Real GDP in year t =$15/1.5 =$10 trillion |
|
|
Gross vs. Net Investment
|
Net Investment = Gross Investment - Depreciation
If there is an increase in Net Investment, then you know that gross investment is greater than depreciation, and the capital stock is growing, meaning there's more likely to be economic growth. |
|
|
GDP vs. GNP
|
GDP - Total dollar value of final output produced each year. Produced in a countries boarders
GNP- Total dollar value of final output produced including goods produced in other countries. |
|
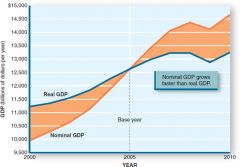
GDP - Nominal vs Real
Interpret the picture |
nominal GDP will grow faster as a result of inflation.
real GDP will show only an increase in output only (prices are adjusted for inflation) |
|
|
Calculate Net Exports
|
Net Exports = Exports - Imports
|
|
|
Calculate unemployment rate
|
# of unemployed
Unemployment rate = --------------------------- Labor Force |
|
|
Calculate labor force participation rate
|
# Labor force
labor force participation rate = ------------------ # working age population |
|
|
Definition of discouraged worker
|
one who isn't actively seeking employment bout would look for or accept a job if available
|
|
|
Definition of underemployed worker
|
people seeking full-time employment who are part time or working at a job below their capability
|
|
|
Season unemployment
|
due to seasonal changes
|
|
|
frictional unemployment
|
brief period of unemployment by those:
moving between jobs entering labor market have skills but looking for the job they want |
|
|
structural unemployment
|
unemployment caused by a mismatch between skills (or location) of job or requirements of available jobs
(not having skills to do available jobs in the area) |
|
|
cyclical unemployment
|
unemployment caused by the lack of jobs for those looking for work
(slow or down economy..lack of labor needed) |
|
|
Okun's Law
|
1% more unemployment results in 2% less output
|
|
|
What is the likely economic response to the unemployment rate rising above or falling below the full-employment rate?
|
Full-employment would drive labor costs higher and increase the costs of goods.
unemployment above the full-employment rate would decrease the demand for goods reducing the amount of output and labor (jobs) needed |
|
|
GDP exclusions
|
Voluntary Labor and Housework
Underground Economy Public and Private Transfer Payments |
|
|
Inflation
|
An increase in the general (average) price level of goods and services in the economy.
|
|
|
Deflation
|
A decrease in the general (average) price level of goods and services in the economy.
|
|
|
Consumer Price Index (CPI)
|
Most widely reported measure of Inflation
|
|
|
CPI =
|
CYP ÷ BYP × 100
|
|
|
Inflation Rate
|
ARI = CPIY (CPI in given year) - CPIPY (CPI in previous year) ÷ CPIPY × 100
|
|
|
Real Income
|
RI = NI ÷ CPI
|
|
|
Real Interest Rate
|
The nominal rate of interest minus the inflation rate.
|
|
|
Wealth Effects
|
People who own assets that decline in value are worse off than
|
|
|
Nominal vs Real income
|
nominal is measured in current dollars
real is the nominal adjusted for inflation-purchasing power |
|
|
Relative vs Average price change
|
Relative price is the price of one good in comparison with the price of other goods
Average price is the price of many goods. |
|
|
Classic Demand side theory
|
hands off gov't
ex. recession a) wages go down - eventually employers hire b) prices go down - eventually spending increases |
|
|
Keynesian demand side theory
|
recession
gov't spending goes up taxes go down Fiscal policy |
|
|
Monetary demand side theory
|
recession
a) increase money supply b) decrease interest rate Federal reserve..(Fed policy) |
|
|
Supply side theory
|
initiated by gov't
a) lower corporate taxes b) deregulate business when appropriate |
|
|
growth recession
|
real GDP grows but less than 3%
|
|
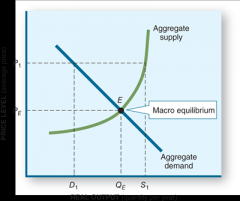
equilibrium (macro):
|
The combination of price level and real output that is compatible with both aggregate demand and aggregate supply
|
|
|
disequilibrium
|

intentions of buyers and sellers are incompatible.
The aggregate quantity supplied (S1) exceeds the aggregate quantity demanded (D1) |
|
|
Aggregate supply shifts
|
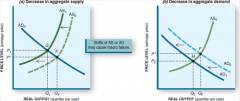
A decrease (leftward shift) of the aggregate supply curve tends to reduce real GDP and raise average prices.
Such a supply shift may result from higher import prices, natural disasters, changes in tax policy, or other events. |
|
|
(b) Aggregate demand shifts
|

A decrease (leftward shift) in aggregate demand reduces output and price levels.
A fall in demand may be caused by decreased export demand, changes in expectations, higher taxes, or other events. |
|
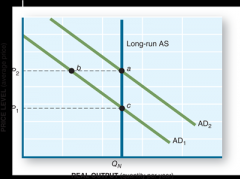
effectiveness of fiscal policy in fighting unemployment and inflation if AS curve is vertical
|
fiscal policy would only work for a short time (temporary increase in sales).
as the cost of production went up the company would have no incentive to produce more. |
|
|
three reasons that explain downward sloping AD curve
|
The real balances effect. - cheaper prices make dollars more valuable.
The foreign trade effect. - prices of U.S. good go down, more goods are exported The interest rate effect. - prices go down, demand goes down, interest rates go down, borrowing goes up all can increase Real GDP |
|
|
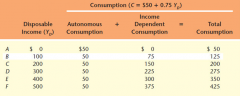
Disposable income =
Yd |
Disposable income = consumption + savings
Yd C S |
|
|
how to use appropriate fiscal or monetary policy in order to adjust graph from an undesirable equilibrium to a full-employment equilibrium
|
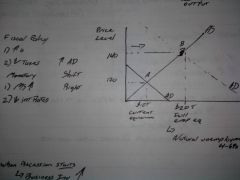
|
|
|
MPC - Marginal propensity to consume
|
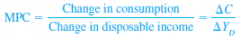
fraction of each additional dollar of disposable income spent
|
|
|
marginal propensity to save (MPS)
|

The fraction of each additional (marginal) dollar of disposable income not spent on consumption;
MPS=1 − MPC |
|
|
components of the consumption function
|

where C = current consumption
a = autonomous consumption b = marginal propensity to consume YD = disposable income |
|
|
Autonomous Consumption
|
Consumer spending not dependent on current income
Expectations wealth effects credit taxes |
|
|
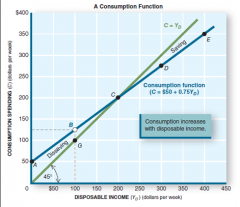
consumption function tells us
|
How much consumption will be included in aggregate demand at the prevailing price level.
How the consumption component of AD will change (shift) when incomes change. |
|
plotting the consumption function
|
|
|
|
Shifts of the Consumption Function
A change in “a” shifts the consumption function up or down; a change in “b” alters the slope of the function. |
A downward shift of the consumption function implies a leftward shift of the aggregate demand curve.
An upward shift of the consumption function implies an increase (a rightward shift) in aggregate demand. |
|
|
AD Shift Factors
|
Changes in income.
Changes in expectations (consumer confidence). Changes in wealth. Changes in credit conditions. Changes in tax policy. |
|
|
determinants that will shift investment demand curve
|
Technology and Innovation
Expectations Interest Rates. When investment spending declines, the aggregate demand curve shifts to the left. |
|
|
recessionary GDP gap
|
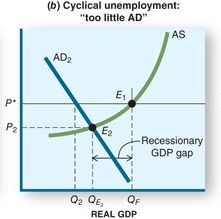
The amount by which equilibrium GDP falls short of full-employment GDP
|
|
|
inflationary GDP gap
|
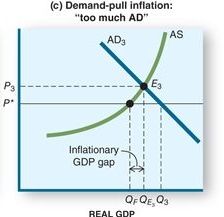
The amount by which equilibrium GDP exceeds full-employment GDP
|