![]()
![]()
![]()
Use LEFT and RIGHT arrow keys to navigate between flashcards;
Use UP and DOWN arrow keys to flip the card;
H to show hint;
A reads text to speech;
19 Cards in this Set
- Front
- Back
|
What are the deviations from mendelian inheritance? |
• Non-independent assortment – e.g. linkage (genes on same chromosome) • Non-Mendelian segregation of phenotypes – e.g. complex gene interactions • These scenarios will result in ratios thatdiffer from the Mendelian cases |
|
|
How do we identify such deviations? |
• Are these different from what is expected? – Are the differences big? What is considered big? – What is the probability that these differences could happen bychance? • Calculate answers to these questions using the x2 Test |
|
|
What does the chi2 test show? |
• Compare observed versus expected results. Are theydifferent and is that difference by chance? • The smaller the difference between observed andexpected, the more likely that it happened by chance. • The c2 Test quantifies the probability that the differenceoccurred by chance. • By scientific convention, a probability value of less than5% indicates that the difference did not occur by chance;i.e. it’s a significant difference. |
|
|
What does the chi2 test mean? |
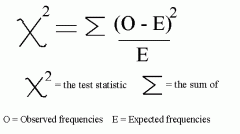
chi2 represents the magnitude of difference between expected and observed. |
|
|
How do you find the probability from the chi2 value? |
Use a chart that convert a c2 value to the probability that thedifference occurred by chance, for the degrees of freedom(dF) of the data. |
|
|
What is the degrees of Freedom (dF)? |
dF = number of values that can vary independently= number of data categories – 1= 2 - 1 = 1 |
|
|
What is the null hypothesis? |
The null hypothesis is the expected result based on anassumption (e.g. 50 heads 50 tails - coin is not biased). |
|
|
What is the p-value? |
The p-value is the probability that the difference between theobserved and result happened by chance (e.g. probability of0.0003 getting 68 heads and 32 tails in 100 coin tosses). |
|
|
What happed is the observed results are very different from the expected? |
If the observed results are very different from expected, thecalculated p-value would be very low and the nullhypothesis is rejected, meaning that the observed results donot fit the underlying assumption |
|
|
What happens if the observed results are similar to the expected results? |
If the observed results are similar to expected as indicated bya high p-value, then the null hypothesis is upheld. Thisoutcome means that the expected result was obtained, whichfit the underlying assumptions |
|
|
What are the problems with studying human inheritance? |
Mendel’s peas – can do controlled matings • Cannot control matings in humans • Can only look at available families – Pedigree analysis • Not many offspring – Few observations |
|
|
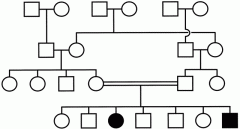
What happens in pedigree analysis? |
Look at family trees • Determine pattern of inheritance (disease) – Dominant or recessive? – Chances of being carriers or affected |
|
|
What are the features of human chromosomes? |
• 2 matching (homologous)sets of chromosomes* • Females have two Xchromosomes • Males have X and Ychromosomes • Non-sex chromosomesare called autosomes |
|
|
What are the hallmarks of autosomal inheritance? |
• Disease appears in progeny of unaffected parents(skip generations) • Affected progeny can be male or female (autosomal,not sex-linked) • Consanguineous (parents who are related) matingsare more likely to produce progeny who arehomozygous recessive |
|
|
How can this be shown on a family tree? |
|
|
|
What can we deduce having inferred autosomal recessive inheritance in the example of neonatal diabetes? |
• we can infer thegenotypes of individuals • Affected individuals– genotype must be INSB/INSB– must have inherited one INSB allele from each parent • Parents unaffected, therefore their genotype must be INSA/INSB • Those who are unaffected but carry a disease-causing allele arecalled carriers |
|
|
What is the proability that this family's next child will have neonatal diabetes? |
Each pregnancy is an independent event. So thechances that the next child will have the disease isstill 1 in 4 (standard 3:1 Mendelian ratio). |
|
|
What are the hall marks of autosomal dominant inheritance? |
• Disease appears in every generation • Affected progeny can be male or female(autosomal, not sex-linked) • Affected individuals have affected parents |
|
|
What can we infer if we know a disease is autosomally dominantly inherited? |
• Unaffected individuals must be INSA/INSA • The affected mother could be INSD/INSD or INSA/INSD • The unaffected son must have received one INSA allele from each parent,which means the mother must be INSA/INSD • The affected son must be INSA/INSD, because he would have received oneINSA allele from the father • If the disease is rare, it is highly likely that the dominant disease-causingallele is also rare. Affected individuals will thus tend to be heterozygous. |