Reading...
![]()
Play button
![]()
Play button
![]()
Use LEFT and RIGHT arrow keys to navigate between flashcards;
Use UP and DOWN arrow keys to flip the card;
H to show hint;
A reads text to speech;
6 Cards in this Set
- Front
- Back

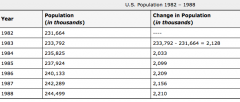
This table provides some U.S. Population data from 1982 to 1988. Note: The change in population from 1982 to 1983 is 2,128,000 which is recorded in thousands in the first row of the 3rd column. The other changes are computed similarly. (Source: http://census.gov/popest/archives/1990s/popclockest.txt) If we were to model the relationship between the U.S. population and the year, would a linear function be appropriate? Explain why or why not.
|
The table shows that over one year periods, the population increases by approximately the same amount (just a little over 2 million per year). Therefore, a linear function is appropriate to model the relationship between the population and the year over this short time interval.
|
|

This table provides some U.S. Population data from 1982 to 1988. Note: The change in population from 1982 to 1983 is 2,128,000 which is recorded in thousands in the first row of the 3rd column. The other changes are computed similarly. (Source: http://census.gov/popest/archives/1990s/popclockest.txt) Mike decides to use a linear function to model the relationship. He chooses 2,139, the average of the values in the 3rd column for the slope. What meaning does this calue have in the context of this model?
|
The slope of the linear function which will model this relationship will measure the change inpopulation per change in time. Its units will be millions of people per year in this problem. A value of 2139 thousand- 2,139,000 for the slope would mean that the population is growing by approximately 2,139,000 people per year.
|
|
This table provides some U.S. Population data from 1982 to 1988. Note: The change in population from 1982 to 1983 is 2,128,000 which is recorded in thousands in the first row of the 3rd column. The other changes are computed similarly. (Source: http://census.gov/popest/archives/1990s/popclockest.txt) Use mike's model to predict the U.S. population in 1992.
|
The population in 1988 was 244,499,000. Mike's choice for slope indicates a population growth of about 4*(2,139,000)= 8,556,000 between 1988 and 1992. Therefore Mike's model predicts that the 1992 population will be approximately 253,055,000 people.
|
|
|
A cup of hot coffee will, over time, cool down to room temperature. The principle of physics governing the process is Newton's Law of Cooling. Experiments with a covered cup of coffee show that the temperature (in degrees Fahrenheit) of the coffee can be modelled by the equation: f(t)=110e^-0.08t+75 where the time t is measured in minutes after the coffee was poured into the cup. Explain, using the structure of the expression 110e^-0.08t+75, why the coffee temperature decreases as time elapses.
|
The only part of the expression representing f(t) involving the variable t is the exponential e^-0.08t. Since the coefficient of t in the exponent, -0.08, is negative the values of f(t) decrease as time passes. This is appropriate as we know from experience that over time coffee will cool down to room temperature. In this case, the 75 in the expression representing f(t) is the ambient room temperature in degrees Fahrenheit.
|
|
|
A cup of hot coffee will, over time, cool down to room temperature. The principle of physics governing the process is Newton's Law of Cooling. Experiments with a covered cup of coffee show that the temperature (in degrees Fahrenheit) of the coffee can be modelled by the equation: f(t)=110e^-0.08t+75 where the time t is measured in minutes after the coffee was poured into the cup. What is the temperature of the coffee at the beginning of the experiment?
|
The beginning of the experiment is when t=0, so, f(0)=110e^-0.08(0)+75=110+75=185. The initial temperature of the coffee is 185 degrees Fahrenheit, a little less than the boiling temperature of water.
|
|
|
A cup of hot coffee will, over time, cool down to room temperature. The principle of physics governing the process is Newton's Law of Cooling. Experiments with a covered cup of coffee show that the temperature (in degrees Fahrenheit) of the coffee can be modelled by the equation: f(t)=110e^-0.08t+75 where the time t is measured in minutes after the coffee was poured into the cup. After how many minutes is the coffee 140 degrees?
|
110e^-0.08t+75=140
e^-0.08t=65/110 -0.08t=ln(65/110) t≈6.6 minutes. |