Reading...
![]()
Play button
![]()
Play button
![]()
Use LEFT and RIGHT arrow keys to navigate between flashcards;
Use UP and DOWN arrow keys to flip the card;
H to show hint;
A reads text to speech;
12 Cards in this Set
- Front
- Back
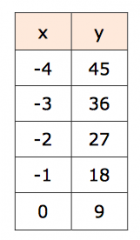
Given this table of values, is this function linear, quadratic, or exponential? Explain how you know.
|
The function is linear because the differences between successive y-values are equal.
|
|
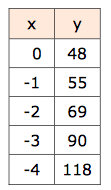
Given this table of values, is this function linear, quadratic, or exponential? Explain how you know.
|
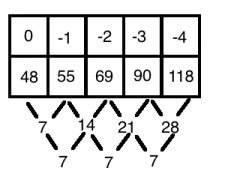
The function is quadratic because the first difference in y-values is not constant but the second difference is, as is shown in the diagram.
|
|
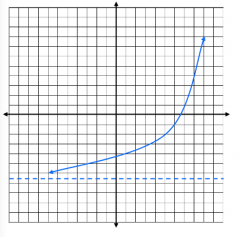
What type of function does this graph show?
|
This graph shows an exponential function.
|
|
|
A fisherman illegally introduces some fish into a lake, and they quickly proagate. The groth of the population of this new species (within a period of a few years) is modeled by P(x)=5b^x, where x is the time in weeks following the introduction and b is a positive unknown base. Exactly how many fish did the fisherman release into the lake?
|
At the exact moment of introduction, t must equal 0, so, P(0)=5b⁰ P(0)=5(1) P(0)=5. The fisherman released 5 fish into the lake.
|
|
|
A fisherman illegally introduces some fish into a lake, and they quickly proagate. The groth of the population of this new species (within a period of a few years0 is modeled by P(x)=5b^x, where x is the time in weeks following the introduction and b is a positive unknown base. Find b if you know the lake contains 33 fish after 8 weeks.
|
We know that x is the time in weeks following the introduction. Assumning that 2 months is 8 weeks, then t=8. If the lake contains 33 fish after two month of P(8)=33, we can solve for b as such: 33=5b⁸ b⁸=33/5 b=(33/5)^1/8 b≈1.266 Thus, b is approximately equal to 1.2 if the lake contains 33 fish after 2 months.
|
|
|
A fisherman illegally introduces some fish into a lake, and they quickly proagate. The groth of the population of this new species (within a period of a few years0 is modeled by P(x)=5b^x, where x is the time in weeks following the introduction and b is a positive unknown base. Suppose that P(x)=5b^x and b=2. What is the weekly percent growth rate in this case? What does this mean in every-day langauge?
|
The "weekly percent growth rate" is the percent increase of the population in one week. since b=2, we know that the population at any time x is given by p(x)=5*2^x, and that the population one week later is given by p(x+1)=5*2^x+1= (5*2^x)*2=2P(x). We learn that the population double each week, which is to say that there is a 100% weekly growth rate.
|
|
|
Suppose P₁=(0,5) and P₂=(3,-3). Sketch P₁ and P₂. For which real numbers m and b does the graph of a linear function described by the equation f(x)=mx+b contain P₁? Explain. Do any of these graphs also contain P₂? Explain.
|
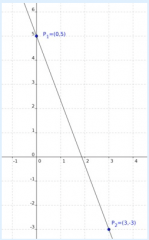
The graph of the linear function described by f(x)=mx+b contains (0,5) when the y-intercept of the graph, given by b is equal to 5. So the linear functions whose graph contains (0,5) are those of the form f(x)=mx+5 where m is a real number. In order for the graph of f to contain (3,-3) we need -3=f(3)=3m+5. Solving for m gives m=-8/3. So there is only one linear function whose graph passes through (0,5) which also passes through (3,-3), namely the function described by f(x)=-8/3x+5
|
|
|
Suppose P₁=(0,5) and P₂=(0,7). Sketch P₁ and P₂. Are there real numbers m and b for which the graph of a linear function described by the equation f(x)=mx+b contains P₁ and P₂? Explain.
|
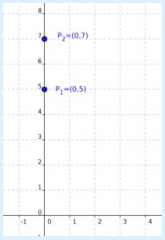
If f is any function, then its graph consists of the pars (x,f(x)). So for each x-value there can only be one associated f(x)-value which is on the graph of f. In this case (0,5) and (0,7) both have x-value zero and so these two points cannot be on the graph of any function, whether or not the function is linear.
|
|
|
Suppose P₁= (c,d) and P₂= (g,h) and c is not equal to g. Show that there is only one real number m and only one real number b for which the graph of f(x)=mx+b contains the points P₁ and P₂.
|
Asking for the point P1=(c,d) to be on the graph of f(x)=mx+b means that d=mc+b. Asking for the point P2=(g,h) to be on the graph of f(x)=mx+b means that h=mg+b. Subtracting the second equation from the first gives d-h=m(c-g), so, m=(d-h/c-g). Once we found m we can plug this into one of the equations and then solve for m. d=(d-f/c-g)c+b. Solving for b gives b=d-(d-h/c-g)c. So with the hypothesis that c≠g, there is a linear function whose graph contains P₁ and P₂ namely f(x)=(d-h/c-g)x+d-(d-f/c-g)c. Finally, we note that we have also that there is a unique such line as any line containing P1 and P2 must have the slope and y-intercept as calculated above. Explicitly: if there were a linear funciton g(x)=m1x+b1 whose graph contained P₁ and P2₂ then by virtue of it containing P₁ we must have d=m₁c+b₁ and the graph of g contains P₂, we must have h=m₁g+b₁. These two allow us to solve for m₁,as above. We then find that b₁=b and so g(x)=f(x): there is only one linear equation in the form f(x)=mx+b whose graph contains P₁ and P₂.
|
|
|
Find all the quadratic functions described by the equation y=ax²+bx+c whose graph contains the two points (1,0) and (3,0) How are the graphs of these functions related to one another?
|
To find the quadratic functions f(x)=ax²+bx+c whose graphs contain the points (1,0) and (3,0) we can evaluate f at 1 and f at 0 to find f(1)=a+b+c=0, f(3)=9a+3b+c=0 Solving the first equation for c gives c=-a-b. plugging this into the second equation gives 9a+3b-a-b=0 or 8a+2b=0 which is the same as 4a+b=0. We cannot determine a or b but for a given a we find that b=-4a and, plugging back into c=-a-b we get that c=-a-(-4a)=3a. So the general form of a quadratic whose graph contains the points (1,0) and (3,0) is fa(x)=ax²-4ax+3a. Pluggining in x=1,3 we verify that fa(1)=fa(3)=0. The list is complete because the arguement above applies to any quadratic function with f(1)=0 and f(3)=0. Note that fa(x)=a(x-1)(x-3) so we have found the same system of parabolas as we did in the first solution.
|
|
|
Mr. Wiggins gives his daughter two choices of payment for raking leaves. 1: two dollars for each bag of leaves filled, 2: she will be paid for the number of bags of leaves she rakes as follows: two cents for filling one bag, four cents for filling two bags, eight cents for filling three bags, and so on, with the amount doubling for each additional bag filled. If his daughter rakes enough to fill 5 bags of leaves, should she opt for payment method 1 or 2?
|
For 5 bags, she should opt for payment method 1.
|
|
|
Mr. Wiggins gives his daughter two choices of payment for raking leaves. 1: two dollars for each bag of leaves filled, 2: she will be paid for the number of bags of leaves she rakes as follows: two cents for filling one bag, four cents for filling two bags, eight cents for filling three bags, and so on, with the amount doubling for each additional bag filled. How many bags of leaves would she have to fill before method 2 pays more than method 1?
|
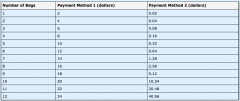
Method 1 pays more up to and including 11 bags, as can be seen in this table of values.
|