![]()
![]()
![]()
Use LEFT and RIGHT arrow keys to navigate between flashcards;
Use UP and DOWN arrow keys to flip the card;
H to show hint;
A reads text to speech;
32 Cards in this Set
- Front
- Back
|
Aggregate demand |
Refers to the total amount of demand for final goods and services in an economy at any point in time. |
|
|
What does the AD curve describe |
There is a negative(downward sloping) relationship between the level of aggregate demand and the overall price level. |
|
|
The explanations for negative relationship between AD and the price level |
-The income or wealth effect -The interest rate effect -The open economy effect |
|
|
Income or wealth effect |
A change in the price level, changes the purchasing power of assets causing consumers to buy more( or less) goods and services. |
|
|
Interest rate effect |
A change in price level, changes the amount of savings in the economy, which changes the interest rate. This leads to a change in borrowing and investment. |
|
|
Interest rate effect |
A change in price level, changes the amount of savings in the economy, which changes the interest rate. This leads to a change in borrowing and investment. |
|
|
Open economy or exchange rate effect |
A change in price level, changes the amount that people from other countries are willing and able to purchase. |
|
|
Determinants of Aggregate Demand |
Changes in Consumer Spending: -Consumer wealth -Consumer expectations -Household indebtedness -Taxes Changes in investment spending: -Real interest rates -Expected returns -Expected future business conditions -Technology -Degree of excessive capacity -Business taxes Changes in net export spending: -National Income abroad -Exchange rates |
|
|
Aggregate demand curve |
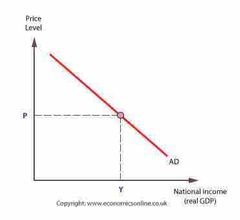
The aggregate demand curve shows the total amount of spending in the economy at each price level. A rise in the price level(higher inflation rate) causes for a movement upwards along the AD curve reducing aggregate spending, employment and real GDP. A fall in price level(lower inflation rate) causes for a movement downwards along the AD curve increasing aggregate spending, employment and real GDP. The x-axis shows the level of output produced in the economy(Real GDP). Whilst y-axis shows the price level(inflation). |
|
|
Increase(rightwards shift) in aggregate demand |
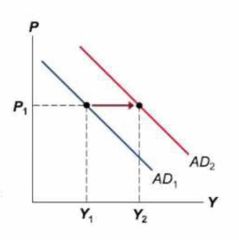
For example: -Government reduced income tax, disposable income will rise and household spending will tend to increase. -A rise in business confidence due to future positive signs in the stock market -An increase in government spending -China economic growth increasing leading to an increase in exports revenue. |
|
|
Decrease(leftwards shift) in aggregate demand |
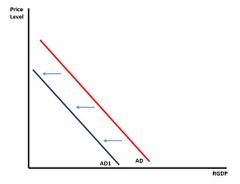
For example -Government announcing that Australia is going into a recession. Decreases consumer confidence. -Stock market crash that causes for future business profits to fall. Business confidence to fall which will decrease investment spending. -China economic growth decreases results in less exports being bought leading to a reduction in net exports. |
|
|
Determinants of Aggregate Supply |
-Input prices: -Domestic resource prices -Land -Labour -Capital -Prices of imported goods -Market power -Productivity: -Legal and institutional environments: -Business taxes and subsidies -Government regulation
|
|
|
Determinants of LRAS curve |
-Size of economy’s work force -Stock of capital equipment -State of technology |
|
|
Characteristics of a contractionary gap |
-Lower rates of inflation, due to space capacity in the economy -Higher levels of cyclical unemployment -A fall in labour force participation rate because many people feel they have less change of finding a job -Lower company profits -Slower growth of consumer expenditure -A reduction in sales of consumer durables -Increased need for social security(Jobseeker allowance) -Lower interest rates -A decrease in the current account balance will increase investment relative to savings |
|
|
Characteristics of an expansionary gap(or boom) |
-Wage inflation if there is a right labour market(competition for workers) -Lower levels of cyclical unemployment- consumer demand for goods and services is high, so firms need to employ labour to produce those goods and services -Increase in participation rate, as people expect they will be able to find a job if they seek work -An increase in company profits and business confidence -Increased consumer confidence and sales of consumer durables -Reduced need for government welfare payments, such as unemployment benefits -Current account balance will fall if investment increases relative to savings |
|
|
Government economic objectives |
-Economic growth -Price stability -Full employment -Equitable distribution of income and wealth -Efficient use of scarce resources |
|
|
Government economic objectives |
-Economic growth -Price stability -Full employment -Equitable distribution of income and wealth -Efficient use of scarce resources |
|
|
Economic growth(Sustainable economic growth) |
-Economic growth is defined as the increasing capacity of the economy to satisfy image material wants of its members. Growth is measured by calculating rate of change in GDP -Economic growth rate is 3-3.5% -Potential growth is determined by the growth in the labour force, and growth of productivity. -Growth is a key objective because it delivers real income and enables people to satisfy more wants. Growth creates more demand for productive resources, including labour. The extent of which growth helps achieve higher employment depends, however, on whether the growth rate exceeds the rate of growth of population and workforce. -Rates that are high are unsustainable in a mature economy as they put pressure on factor markets( I.e. markets for raw materials and labour) and risk driving up factor prices(demand inflation) -When growth is slow(as in the three years when it was below 2%) there is insufficient demand to fully employ resources. -Pandemic brought in a recession because of its dual impact on aggregate demand and aggregate supply, and it will also impact Australia’s long term growth potential because it has reduced net migration and the natural rate of population increase. -Sustainable growth refers to maintaining a rate of growth without creating significant problems for future generations. |
|
|
Price stability |
-Inflation refers to the increasing level of prices of goods and services reducing the purchasing power of the consumer. -Price stability refers to maintaining a low inflation rate over the course of the business cycle. -Inflation target rate is 2-3% -If inflation is too high, prices might rise faster than incomes. This means people can afford fewer goods and services than before, making them worse off. Some reasons high inflation could occur: -The economy grows faster than the speed limit. Demand for goods and services may exceed what businesses can supply and businesses increase wages if it is difficult to find workers. Both of these factors will lead to higher prices(demand pull). -The supply of some goods and services is disrupted(e.g. A natural disaster destroys crops) than their price may increase. This can have a widespread effect in other prices of goods and services(such as oil). -If inflation is too low, then prices might stay the same or even fall(deflation). While this may sound good for consumers falling prices harm the economy because: -If businesses may smaller profits, they can’t afford to employ as many people. High unemployment leads to less spending on goods and services, further damaging business profits, economic growth and increasing unemployment. -decision makers may decide to reduce spending today, to wait until goods and services are cheaper in the future. Lower spending today harms economic growth and can also lead to a rise in unemployment. -One indication of inflation is the Consumer Price Index(CPI), which mashes the change in the price of the ‘basket’ of goods and services consumed by the average household. Inflation is measured as the change in the price of the basket over time. If inflation is 3%, a basket of goods and services that costs $100 last year will cost $103 this year. |
|
|
Full employment |
-Full employment occurs when everyone who is willing and able to work can find a job. -Frictional unemployment is 1.5-2.5 of unemployment at any time. -Structural unemployment is 2-3% of unemployment at any time. -Natural rate of unemployment is the lowest rate of unemployment that can be achieved without inflationary pressure developing. -Unemployment refers to people who are actively seeking a job or want a job but are unable to find suitable employment. -Unemployment is 3.4% -Target rate is 4% -Measurement of unemployment is the unemployment rate as it shows the degree of spare capacity in the economy. -If everyone who wants to work has a job and is working as many hours as they like, then the economy is operating at full capacity and should grow around its optimal speed. |
|
|
Equitable distribution of income and wealth |
-ensures distributing welfare to ensure fairness and allowing members of the economy to have the same opportunity to accumulate wealth. -Aims to increase equity and equality of opportunity in the community, enable all members of our society to achieve acceptable standard of living. -It is achieved by product of achieving these objectives(growth promotes prosperity and opportunity). -Measured by the Gini index. Which measured income inequality. 0 meaning perfect equality and 1 meaning perfect inequality. |
|
|
Efficient use of scarce resources |
-Refers to maximising resources efficiently so that actual output is close to potential wastage, minimising market inefficiency. -Increasing productivity and efficiency is key ways of increasing prosperity in the future. |
|
|
Compatible policy objectives |
-Economic growth and full employment(lower unemployment)- growth creates more demand for goods and services, and thus the resources used in production(derived demand). Economic growth also improves material welfare, so aggregate demand will rise, providing stimulus to the expansion of output and employment. Policies to achieve lower unemployment also promote growth-higher levels of employment reduce the gdp gap and means economy operates near potential. -Full employment and equal distribution of income- Policies designed to lower unemployment should lead to a more equitable income distribution because, other things being equal, work provides income with which to consume, save and build wealth. -Price stability and economic growth- Keeping inflation low is an important prerequisite for promoting sustainable economic growth. Low inflation reduces uncertainty, encourages investment in productive activities and promotes international competitiveness. -Efficient resource allocation, productivity and economic growth- Efficiency and productivity are the driving forces in the long run aggregate supply. Improved efficiency use also lowers the cost of supply and helps to reduce inflationary pressures. |
|
|
Conflicting objectives |
-Price stability and full employment-Policies to reduce demand pull inflation generally aim to reduce the level of economic activity. If this reduces business activity and investment there may be less demand for labour. On the other hand, reducing unemployment by expanding economic activity puts pressure on available resources and prices. This suggests a trade off between high employment and stable price levels. -Economic growth and price stability-A booming economy places demand pressure on resources, especially if there is no excess capacity-this is inflationary because competition for resources pushes up their prices in factor markets(including labour). -Economic growth and structural unemployment-Economic growth is associated with structural change, which often involves the rise of some sectors and the decline of others. Structural change impacts on the labour market and long term unemployment -Economic growth and equitable income distribution- While economic growth increases the size of the economic pie, not everyone gets an equal slice of the pie. This is especially the case in the short term. People employed in the expanding sectors and owners of appreciating assets such as property and shares tend to gain in relative terms. |
|
|
Economic policy institutions |
Three types of economic policy applied in Australia: -Fiscal policy( the use of government revenue raising and spending powers to influence level of economic activity -Monetary policy( the use of the ‘cash rate’ to influence other interest rates) -Competition and industrial policy( to improve efficiency and productivity) |
|
|
Fiscal Policy |
-Fiscal policy summarises the governments spending commitments and collection of taxes from households and businesses. Government spending increases when in contraction. Decreases in expansion. |
|
|
Monetary policy |
-Cash rate is lowered when economic growth is slowing, inflation is too low and unemployment is too high. This incentives consumers to borrow more money increasing inflation and growth, decreasing unemployment -Cash rate rises when economist is expanding too quickly and inflation is too high. This leads to interest rates rising and borrowing money more expensive. Households/businesses spend less. Economic growth decreases, inflation decreases, unemployment rises. |
|
|
Types of time lags |
-Recognition lag -Second time lag(decision lag) -Effect lag |
|
|
Recognition Lag |
The period of time it takes to recognise what is happening in the economy(at macroeconomic level). The recognition lag makes driving the economy somewhat akin to driving a car. Policy makers are forced to look backwards to see what direction the economic road just took. |
|
|
Second time lag(decision lag) |
Occurs because it then takes policy makers some time to decide what policy changes should be made in the light of the economic data. Decision lag is fairly short because the Reserve Bank Board meet every month. |
|
|
Effect lag |
It can then take some time for policy decisions to have an effect on households and business behaviour. The full impact of the policy may not be felt for months. |
|
|
Time lags |
Occurs whenever time passes between when an activity is initiated and when activity has its impact |