![]()
![]()
![]()
Use LEFT and RIGHT arrow keys to navigate between flashcards;
Use UP and DOWN arrow keys to flip the card;
H to show hint;
A reads text to speech;
48 Cards in this Set
- Front
- Back
|
Demographic Stochasticity |
principle that if a population contains relatively few individuals, chance variations in the sex ratio of offspring or the survival and reproductive success of individuals can prevail over what is expected on average.
net effect: the rate of population growth will vary from year to year. |
|
|
Environmental Stochasticity |
refers to fluctuations over time in environmental conditions that affect reproduction or survival of individuals. |
|
|
Allee Effect |
the positive correlation between population size and individual success.
Figure 7.3 queen conch Figure 7.4 red hot poker plants
|
|
|
Genetic Drift |
evolutionary process of random changes in gene frequencies |
|
|
Genetic Rescue |
improved population fitness that results from interbreeding with immigrant individuals |
|
|
Effective Population Size |
Ne = effective population size Ht = heterozygosity after t generations Ho = original heterozygosity
Heterozygosity is lost more quickly in populations with smaller Ne
The more generations a population remains at a small Ne the more genetic diversity it will lose. |
|
|
Gene Flow |
the exchange of alleles among populations resulting from the movement and cross-mating if individuals from distinct populations. |
|
|
Why does allelic diversity tend to decline in small, isolated populations? |
combination of genetic drift and limited gene flow. |
|
|
Why is an individual whose parents are closely related likely to suffer reduced fitness? |
inbreeding increases homozygosity which can be a disadvantage relative to heterozygosity.
inbreeding increases the chance that an individual will carry two copies of a rare harmful recessive allele |
|
|
which is an assumption of an ideal population? |
even sex ratios |
|
|
Relationship between effective population size and variance in offspring production. |
Ne can equal the raw count of individuals
Ne=N |
|
|
Fig 7.4 The figure below shows that red hot poker plants planted in small groups (with few other red hot poker individuals) did not produce as many seeds per plant compared to individuals planted in large patches. |
the fitness of an individual plant was positively related to patch size, but only when birds were able to access them. This is evidence of the Allee Effect, because birds are less likely to visit and pollinate flowers that exist in small patches. |
|
|
Ideal Population |
assumes the number of individuals is constant, all individuals are breeding adults, and the numbers of males and females are equal. |
|
|
Relative abundance |
the number of individuals spotted or trapped per unit of effort estimates___________. |
|
|
Quadrats |
small rectangular plots of land where researchers can record the density of individuals. |
|
|
If you used a Lincoln–Petersen mark-recapture approach to estimate the size of an animal population, but the tags were defective and fell off some percentage of the originally sampled individuals, the method would tend to |
overestimate population
r/s would be reduced
r = recaptured s = individuals sampled m = marked individuals |
|
|
If you used a Lincoln–Petersen mark-recapture approach to estimate the size of an animal population, but the tags were attractive to predators, the method would tend to |
overestimate population
underestimate r inflate N |
|
|
If you used a Lincoln–Petersen mark-recapture approach to estimate the size of an animal population, but tagging individuals affected their probability of recapture, the method would tend to |
if tag decreased probability of recapture you would overestimate population
if tag increased probability of recapture you would underestimate population |
|
|
Using a species' current level of genetic diversity to estimate its historic population size requires data, or at least a range of assumptions about |
rate of mutations current Ne species generation time |
|
|
The 30-year-long effort in India to census the nation’s tiger population could have been improved by |
tracking time spent searching for pugmarks
tracking locations of pugmarks as they were found
|
|
|
This simple model of exponential population change, Nt + 1 = λNt, assumes |
constant environmental conditions
unlimited resources
identical probabilities of survival and reproduction for all individuals |
|
|
To perform even the most basic population viability analysis requires all of the following |
population growth rate
starting population size
variability in population growth rate
|
|
|
PVA (Population Viability Analysis) |
used to estimate the probability of extinction within a time expected average population size at some time the range of population sizes that is likely at some specified time (95% CI) |
|
|
Loci |
stretches of DNA that do not code for proteins or RNA |
|
|
Population Growth Rate ∂ = Nt+1/Nt |
the realized rate of change is the geometric mean ∂
ie: √.09 x 1.2 x .08 = .952
[1-.95 = .5] or 5% decline or change |
|
|
Demographic Matrix Model |
models that better reflect the real world
uses age, stage or size as the probabilities of birth and death |
|
|
Population Growth Rate Model |
unrealistic assumptions: density independent population change (+or- growth at constant rate) deterministic population dynamics (no environmental stochasticity, (good/bad years) homogenous individuals (same reproductive success) closed population (no movement in or out of population other then birth and death)
|
|
|
Habitat Fragmentation |
can lead to: edge effects metapopulation dynamics faunal relaxation |
|
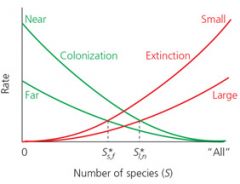
The rate of colonization increases as...
|
distance from mainland decreases |
|

The rate of extinction increases as... |
# of species grows |
|
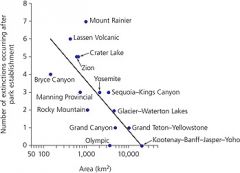
what does this graph mean? |
larger parks have experienced fewer mammal extinction since established |
|
|
SLOSS Single Large Or Several Small |
different size reserves could harbor a greater # of species, depending on the degree of species nestedness |
|
|
High degree of nestedness |
one large reserve harbors more species |
|
|
Low degree of nestedness |
several small reserves harbor more species |
|
|
The theory of island biogeography |
makes it clear that a single large habitat will, on average, sustain more species than a single small habitat |
|
|
nestedness |
increases with species overlap (high degree) |
|
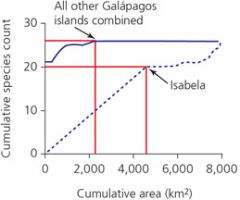
according to this figure: |
isabella harbors fewer native land bird species than all the other G. islands combined, despite the fact that isabella is larger than the cumulative area of the other islands |
|
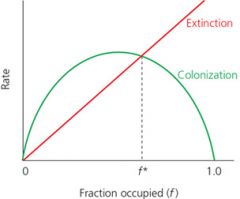
according to this figure: |
colonization is highest when half of the habitat patches are occupied
extinction increases linearly with patch occupancy
extinction is equal to the rate of colonization at two points (f* and f=0) |
|
|
Dispersal Corridors can benefit by what? |
facilitating recolonization of an area following local extirpation
facilitating gene flow that can alleviate inbreeding depression
|
|
|
Inbreeding Depression |
a reduction in the survival or reproductive fitness of offspring produced through inbreeding |
|
|
Negative consequences to dispersal corridors |
ecological traps
disrupt evolutionary divergence
facilitate movement of non-native species among patches |
|
|
Inbreeding coefficient (Fst) |
can be used to measure the degree of isolation of subpopulations
a high Fst indicates a dispersal corridor may be a good investment because migration between subpopulations is currently limited |
|
|
Edge effects |
differences in both environmental and biotic conditions between the edges and the interiors of habitat patches
|
|
|
Faunal relaxation |
shrinking of number of species
|
|
|
habitat matrix |
area surrounding the protected one |
|
|
Buffers |
overcome the edge effects |
|
|
metapopulations |
a collection of spatially isolated subpopulations of the same species that interact at some level |
|
|
The equilibrium theory of island biogeography |
equilibrium number of species on a large, less isolated island is greater than the equilibrium number of species on a small, more isolated island.
(based on colonization/extinction rate)
|