![]()
![]()
![]()
Use LEFT and RIGHT arrow keys to navigate between flashcards;
Use UP and DOWN arrow keys to flip the card;
H to show hint;
A reads text to speech;
38 Cards in this Set
- Front
- Back
|
What is taxonomy |
Groups which organisms are placed into |
|
|
What are the taxonomic groups |
Domain kingdom phylum class order family genus species |
|
|
Why do you classify organisms |
To identify species Predict characteristics Find evolutionary links |
|
|
How do we classify organisms |
Anatomy DNA Behaviour Phylogeny |
|
|
What is a species |
A group of organisms which can produce a fertile offspring |
|
|
Why cant an organism with odd number of chromosomes reproduce |
Meiosis and gamete production cant occur correctly as all chromosomes must pair up |
|
|
Importance if classification |
provide information about relationships between organisms Sciences can easily share information evading the language barrier |
|
|
Binomial nomenclature |
2 part scientific name Genus and species Should be underlined to represent italics Genus should be capitalized Species should be all lowercase |
|
|
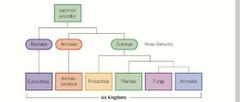
What are the 5 kingdoms |
Prokaryotae Protoctista Fungi Plantae Animalia |
|
|
Prokaryotae |
Unicellular No nucleus No visible feeding mechanism |
|
|
Protoctista |
Unicellular mainly Nucleus Chloroplast some Autrotrophic and heterotrophic feeders |
|
|
Fungi |
Unicellular or multicellular Nucleus Chitin cell wall No chloroplast Saprophytic feeders |
|
|
Domains |
Eukarya-80s ribosomes, 12 proteins in RNA polymerase Archea-70s ribosomes, 8 to 10 proteins Bacteria-70s 5 protiens |
|
|
Structure diagram |
|
|
|
Difference between eubacteria and archeabacteria |
Different chemical make up Eubacteria have peptidoglycan walls |
|
|
Archeabacteria |
Live in extreme conditions Anaerobic, thermal vents, acidic |
|
|
Eubacteria |
Found in all environments |
|
|
Phylogeny |
Evolutionary relationship between organisms Reveals which group a particular organism belongs to and how closely related they are |
|
|
phylogenetic tree |
Diagram which represents evolutionary relationships between organisms Branched diagrams that show which species evolved from a common ancestor Earliest at base must recent at tips |
|
|
Advantages of phylogeny |
Classification uses phylogeny to confirm or correct classification groups Produces a continuous tree and not forced to put them in groups Classification implies groups have same rank |
|
|
Evidence of evolution |
Fossil records Similarities and differences DNA Similarities and differences in base sequences Similarities and differences ATP synthase Similarities and differences in order of amino acids Similarities and differences behaviour and anatomy |
|
|
How are fossils formed |
Animal and plant remains preserved in rocks |
|
|
How fossils provided theory of evolution |
Show organisms change over time Fossils can be dated showing a sequence Simplest species are in the older rocks DNA extracted can also be compared |
|
|
Homologous structures |
Structure which is superficially different but have the same underlying structure Provides evidence for divergent evolution |
|
|
Divergent evolution |
Different species evolved from a common ancestor each with a set of different adaptive features |
|
|
Interspecific variation |
Variation between species |
|
|
Intraspecific variation |
Variation within species |
|
|
Causes of genetic variation |
Different alleles Mutations Meiosis Sexual reproduction Chance |
|
|
Discrete variation |
No intermediate values Determined mostly by genetics Bar chart pie chart Blood type |
|
|
Continuous variation |
Intermediate values Controlled by multiple Gene's and environment Histogram curves |
|
|
Normal distribution |
Mean mode and median are the same Bell shape 50% values less than mean Shape of a plotted continuous graph Most values lie close to mean |
|
|
Standard deviation |
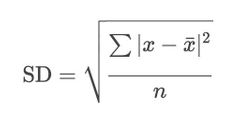
Spread of data |
|
|
Students t test |
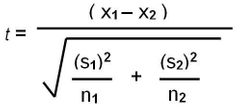
Compare means of data values of two populations Data collected must be normally distributed Enough data collected to show a reliable mean S is standard deviation X is mean N is total values |
|
|
Spearman rank correlation coefficient |
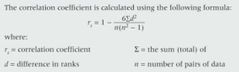
To see how related 2 sets of data are |
|
|
What are adaptations |
characteristics that increase an organism chance of survival and reproduction in its environmentAnatomicalBehaviouralPhysiological |
|
|
Selection pressure |
Factors that affect the organisms chances of survival or reproductive success |
|
|
Natural selection |
Random mutation occurs Selection pressure arises Individuals with the right alleles survive Alleles passed on the next generation Over many generations frequency of characteristics increases |
|
|
Selective breeding |
Cross bread with wanted characteristics Select best offspring Interbreed best offspring Do over many generations |