![]()
![]()
![]()
Use LEFT and RIGHT arrow keys to navigate between flashcards;
Use UP and DOWN arrow keys to flip the card;
H to show hint;
A reads text to speech;
26 Cards in this Set
- Front
- Back
|
Transportation modes |
Planes
Trains Automobiles and boats |
|
|
Transporation consideration factors
|
safety
Reliability Convenience Cost . |
|
|
improvng transportation |
Pros - reduce costs of mateials - increases competition - Greater consumer choice - Critical for emergencies Cons - Requires resourcce use - danger potential - noise, delay, pollution |
|
|
Supply and demand |
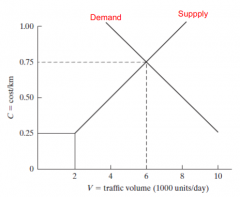
Affected by: - Market forces - Gov't - Technology exTraffic crossing a bridge |
|
|
Driver characterisitcs |
ability to: - hear - see - - periheral vision - - - decreases as speed increases - - color vision - - - best colour choice is black/white, black/yellow - - glare vision and recovery - - - 3 seconds D-L, 6 sec L-D - - depth perception - evaluate - react |
|
|
PIEV |
Perception Identification Emotion (Evaluation) Reaction unexpected - 1.6-7.8 sec expected - 1.0-5.1 |
|
|
Pedestrian characteristics |
Most vulnerable avg speed: .9-2.4m/s (handicap@ ~1/2) |
|
|
Different oad users |
Vehices Pedestrians Cyclists |
|
|
Bicylist characterisitcs |
Class A) - experienced in mixed traffic Class B) - less exp, neighbbourroads and bike lanes Class C) - Lease experience (the grade for riding performance) avg speed down - 50 km/h lvl - 30 km/h up - 13 km/h |
|
|
Vehicle characterisitics |
static char. - size - axel weight kinematic char. (motion) - acceleration, velocity, position dynamic char. (forces) - Air resistances - rolling resistance - curve resistances - power - grade |
|
|
km/h to m/s |
0.077 = (1000/3600)^2 |
|
|
SSD DSD PSD |
Stopping sight distance Descision sight distance (includes reaction to unexpected event) Passign sight distance |
|
|
Purpose of speed spot studies |
establish traffic parameters - eval control devices - eval enforcement - eval road geom - eval safety - speed trends - check speed complaints |
|
|
spot speed req'd |
- mid block - flat level highway - inersections - ensure unbias typically 1hr & >30 vehicles |
|
|
volume studies |
AADT ADT PHV VC VKT |
|
|
travel time and delay studies |
floating car avg speed movinf speed liscence obs questionarres Intelligent transport sys and other tech |
|
|
moving vehicle technique |
time both direc Number of oncoming cars while 1st direction vehicles overtaking and passed while 2nd direction |
|
|
safety managment process |
Network screening Diagnosis Remedy Econoic appraisal prioritize project Eval repeat |
|
|
Regressino to the mean |
over time statistics balance at the mean benefit illusion |
|
|
Crash rate notes |
Volumes < 2700, CR is is significantly high |
|
|
Evaluate crash |
Crash Freq Crash rate (indludes exposure) Crash sev (accounts injuries vs PD Stat QC techniq (poisson) |
|
|
Diagnosis process |
Safteyy data review - descriptive stats - analytical methods - crash mapping Asses supporting docs Asess fied cond Ident concerns |
|
|
Time mean speed vs spacemean speed |
aritmetic mean vehicles past a point harmonic mean (more accurate) |
|
|
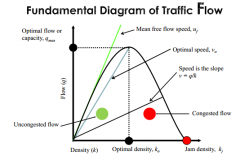
fundamental diagram |
|
|
|
Greenshields Greenberg |
Assumes linear relation btwn speed and density Assumes non-linear |
|
|
causes of shoclwaves |
discontinuity in a state var (q, u,, k) changes in: geom flow cond abnormaslites |