Reading...
![]()
Play button
![]()
Play button
![]()
Use LEFT and RIGHT arrow keys to navigate between flashcards;
Use UP and DOWN arrow keys to flip the card;
H to show hint;
A reads text to speech;
17 Cards in this Set
- Front
- Back
- 3rd side (hint)
|
Probability
|
Chance of an event occurring.
|
When a single die is thrown, there are six possible outcomes: 1, 2, 3, 4, 5, 6.
The probability of throwing any one of these numbers is 1/6. |
|
|
Categorical Variable
|
Types of data which may be divided into groups.
|
Examples of categorical variables are race, age group, and educational level.
|
|
|
Experiment
|
A deliberate action done to individuals in order to observe their responses.
|
Purposely assigning one group a treatment and another group another treatment and comparing the results.
|
|
|
Observational Study
|
The act of observing individuals and measuring variables of interest without attempting to influence the responses.
|
Example: An individual wants to know if women or men are more likely to answer questions when asked on the street, so they ask 100 random men and 100 random women and record the results.
|
|
|
Sample
|
A portion of individuals that are part of a population meant to represent the population.
|
Example: 60 high school students chosen to represent the entire student body at a high school
|
|
|
Population
|
Individuals of interest as a whole.
|
Example: The United States population as a whole.
|
|
|
Individual
|
Objects described by a set of data.
|
People subjected to the survey.
|
|
|
Variable
|
Characteristic of the individual to be measured or observed.
|
EX:
Time spent exercising |
|
|
Quantitative Variable
|
A variable with a numerical measurement.
|
Examples include weight, height, test scores.
|
|
|
Distribution
|
Information explaining what values the variable takes and how often it takes these values.
|
Stem Plots, Pie Charts, Bar Graphs, Dotplots, Box-and-Whisker Plots, etc.
|
|
|
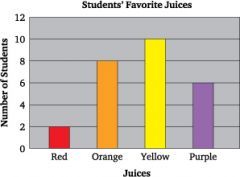
Bar Graphs
|
A graphic means of data distribution by rectangles with lengths proportional to the measure of the data being compared.
|
|
|
|
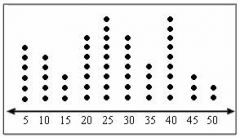
Dot plot
|
a dot plot is a graphical representation of data with dots over a number line. each dot represents a value.
|
|
|
|
Explanatory Data Analysis
|
The act of using graphs and numerical summaries to describe the variables in a data set and the relations among them.
|
Example: bar graph, dot plot, stem plot, scatter plot, histogram
|
|
|
Statistical Inference
|
Produces answers to specific questions, including a statement of how confident we can be to say that the answer is correct.
|
Ex: 80% of the teenagers at Leland High School prefer Soda to Juice. This can be attributed to the amount of sugar within the drink.
|
|
|
Dealing with Data (steps involved)
|
1. Identify individuals and variables in a set of data.
2. Classify each variable as categorical/quantitative. Identify units. 3. Answer key questions (Who, What, Why, When, Where, How, and by Whom? |
Ex: Dogs and Cats (individuals), variables (lifespan, exercise time)
Lifespan and Exercise time (quantitative, years and hours) Breeds of Dogs and Cats (categorical) |
|
|
Probability (steps involved)
|
1. Interpret probability as what happens in the long run.
2. Use simulations to determine how likely an outcome is to occur. |
Performing a simulation a large number of times will give a probability of the event occurring in the long run.
|
|
|
Survey
|
A form of observational study used to gather data for an analysis of some aspect of a group or area.
|
Phone calls asking for political opinion during an election.
|