![]()
![]()
![]()
Use LEFT and RIGHT arrow keys to navigate between flashcards;
Use UP and DOWN arrow keys to flip the card;
H to show hint;
A reads text to speech;
20 Cards in this Set
- Front
- Back
|
categorical
|
A categorical variable places an individual into one of several groups or categories.
|
|
|
quantitative
|
A quantitative variable takes numerical values for which arithmetic operations such as adding and averaging make sense.
|
|
|
distribution
|
The distribution of a variable tells us what values the variable takes and how often it takes these values.
|
|
|
When describing the overall pattern of a distribution, you MUST address the following 4 things.
|
1. The CENTER of the data
2.The SHAPE of the data 3. The SPREAD of the Data 4. Any OUTLIERS in the data |
|
|
Percentile |
= (number of scores x)/(total number of scores) * 100
|
|
|
Q1 |
First Quartle |
|
|
Q3 |
Third Quartile |
|
|
Symmetry:
|
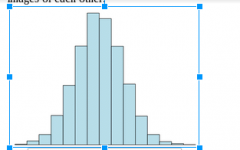
A distribution is symmetric if the right and left sides of the histogram are approximately mirror images of each other.
|
|
|
Skewed Right |
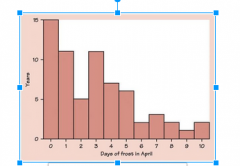
A distribution is skewed to the right if the right side of the histogram extends far to the righ
|
|
|
Skewed Left |
A distribution is skewed to the left if the left side of the histogram extends far to the left.
|
|
|
The Median
|
is the measure of center which is resistant to outliers and skewness. The median is the midpoint of a distribution. The number such that half the observations are smaller and the other half are larger.
|
|
|
The Mean
|
The most common measure of center is the mean. The mean is the arithmetic average.
|
|
|
Comparing the Mean and Median
|
The mean and median in a symmetric distribution will be very close to each other. If a distribution is skewed to the left, the mean will be smaller than the median, and if the if the distribution is skewed to the right, the mean will be greater than the median.
|
|
|
The Range
|
The difference between the largest and smallest observation (max – min).The range is useful if there are no outliers.
|
|
|
The Interquartile Range (IQR)
|
is the range of the middle 50% of the data.
|
|
|
To find the IQR:
|
Q3-Q1 |
|
|
Five Number Summary
|
Low
Q1 Median Q3 High From this summary, you can develop a good sense of the center and spread of your data. |
|
|
Outliers
|
One general rule of thumb for identifying outliers is finding any data points that lie
Lower than 1.5 * IQR below Q1 OR. Higher than 1.5 * IQR above Q3. |
|
|
The Standard Deviation
|
Standard deviation is the measure of spread most commonly used in statistical practice when the mean is used to calculate central tendency. Thus, it measures spread around the mean. Because of its close links with the mean, standard deviation can be greatly affected if the mean gives a poor measure of central tendency.
|
|
|
Properties of standard deviation
|
When using standard deviation keep in mind the following properties.
Standard deviation is only used to measure spread or dispersion around the mean of a data set. Standard deviation is never negative. Standard deviation is sensitive to outliers. A single outlier can raise the standard deviation and in turn, distort the picture of spread. For data with approximately the same mean, the greater the spread, the greater the standard deviation. If all values of a data set are the same, the standard deviation is zero (because each value is equal to the mean). The units of measure of the standard deviation is the same as the original data |