![]()
![]()
![]()
Use LEFT and RIGHT arrow keys to navigate between flashcards;
Use UP and DOWN arrow keys to flip the card;
H to show hint;
A reads text to speech;
13 Cards in this Set
- Front
- Back
|
Aggregate demand |
Sum total of the expenditure that people plan to incur on purchase of goods and services produced in the economy corresponding to their different levels of income during one accounting year |
|
|
Components of AD |
AD = C + I + G + (X - M) |
|
|
Investment |
1) Induced investment - refers to investment made by the private sector with a motive of earning profits. It increases with increase in level of income. 2) Autonomous investment - refers to the investment made by the govt with an objective of social welfare. It remains constant irrespective of the level of income. |
|
|
Aggregate supply |
It refers to the flow of goods and services as planned by the producers during one accounting year, it is identical to income (Y). AS = Y. IAS curve is a 45° line |
|
|
Propensity to consume |
It refers to the proportion of income used as consumption expenditure, it's the ratio between C and Y |
|
|
Consumption function |
1) There is always some minimum level of consumption even when income is 0, this is called Autonomous Consumption. This leads to negative saving (-S) 2) Consumption is positively related to income. 3) Rate at which C rises is < Rate at which Y rises. 4) The point where C = Y is called the Break-even Point. 5) C = Ç + bY ; Ç = Autonomous Consumption, b = MPC, Y = income |
|
|
APC MPC |
1) MPC is the slope of the C function. 2) APC = C/Y 3) MPC = Delta C/Delta Y 4) Linear consumption function is a function where MPC is constant. 5) APC is the ratio of total consumption and total income 6) MPC is the ratio of between additional consumption and additional income |
|
|
Propensity to save |
It refers to the proportion of income which is kept as saving, it is measured as the ratio between S and Y. |
|
|
Saving function |
1) S = Y - C. 2) S is positively related to Y. 3) S will always remain lower than Y. 4) The point where S = 0 is called the Break-even Point. 5) S = -Ç + (1-b)Y ; Ç = autonomous consumption, 1-b = MPS, Y = income. |
|
|
APS MPS |
1) APS = S/Y 2) MPS = Delta S/Delta Y 3) Slope of S function is MPS 4) APS is the ratio between total saving and total income 5) MPS is the ratio between additional saving and additional income 6) Linear saving function is one where MPS is constant. |
|
|
Relationship between APC APS, MPC MPS and it's range |
1) APC + APS = 1 2) MPC + MPS = 1 3) When C > Y APC > 1 When C = Y APC = 1 When C < Y APC < 1 4) APC can never be 0 5) APC falls with increase in income 6) MPC - [0, 1] 7) MPC falls as income increases 8) APS can never be >=1 9) APS can be 0 at Break-even Point 10) APS rises with increase in income 12) APS can be negative 11) MPS is always positive |
|
|
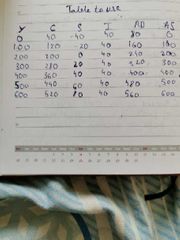
Table to use for schedule |
|
|
|
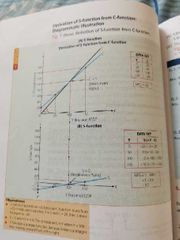
Consumption and Saving function graph |
|