Reading...
![]()
Play button
![]()
Play button
![]()
Use LEFT and RIGHT arrow keys to navigate between flashcards;
Use UP and DOWN arrow keys to flip the card;
H to show hint;
A reads text to speech;
39 Cards in this Set
- Front
- Back
|
AVERAGE
|
(i) The (arithmetic) mean (ii) Any measure of central tendency
|
|
|
BAR CHART or BAR GRAPH
|
A graphical method of presenting data. A plot that shows frequencies for categorical data as heights or lengths of bars, with one bar for each category.
|
|
|
BIAS
|
A sampling method is biased if each element does not have an equal chance of being selected. A sample of internet users found reading an online statistics book would be a biased sample of all internet users. A random sample is unbiased. Note that possible bias refers to the sampling method, not the result. An unbiased method could, by chance, lead to a very non-representative sample.
|
|
|
BIAS
|
An estimator is biased if it systematically overestimates or underestimates the parameter it is estimating. In other words, it is biased if the mean of the sampling distribution of the statistic is not the parameter it is estimating, The sample mean is an unbiased estimate of the population mean. The mean squared deviation of sample scores from their mean is a biased estimate of the variance since it tends to underestimate the population variance
|
|
|
BIMODAL DISTRIBUTION
|
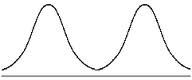
A distribution with two distinct peaks
|
|
|
BIN WIDTH
|
Also known as the class interval, the bin width is a division of data for use in a histogram.For instance, it is possible to partition scores on a 100 point test into class intervals of1-25, 26-49, 50-74 and 75-100.
|
|
|
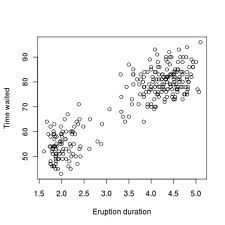
BIVARIATE DATA
|
Data that involve two variables per case. For quantitative variables, often displayed on a scatterplot. For categorical variables, often displayed in a two-way table.
|
|
|
BOX PLOT
or Box-and-whisker plot |
A graphical display of the five-number summary. The "box" extends from the lower quartile (Q1) to the upper quartile (Q3), with a line across it at the median (Q2). The "whiskers" run from the quartiles to the minimum or maximum.
|
|
|
CLASS FREQUENCY
|
One of the components of a histogram, the class frequency is the number of observations in each class interval.
|
|
|
CENTRAL TENDENCY
|
There are many measures of the center of a distribution. These are called measures of central tendency. The most common are the mean, median, and, mode.
|
|
|
CLASS INTERVAL
|
Also known as bin width, the class interval is a division of data for use in a histogram. For instance, it is possible to partition scores on a 100 point test into class intervals of 1-25, 26-49, 50-74 and 75-100
|
|
|
CONFOUNDING
|
Two or more variables are confounded if their effects cannot be separated because they vary together. For example, if a study on the effect of light inadvertently manipulated heat along with light, then light and heat would be confounded
|
|
|
CUMULATIVE FREQUENCY DISTRIBUTION
|
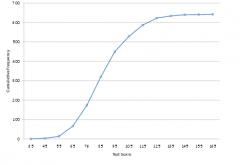
A distribution showing the number of observations less than or equal to values on the X-axis. The following graph shows a cumulative distribution for scores on a test
|
|
|
DESCRIPTIVE STATISTICS
|
1. The branch of statistics concerned with describing and summarizing data. 2.A set of statistics such as the mean, standard deviation, and skew that describe a distribution.
|
|
|
DEVIATION SCORES
|
Scores that are expressed as differences (deviations) from some value, usually the mean. To convert data to deviation scores typically means to subtract the mean score from each other score. Thus, the values 1, 2, and 3 in deviation-score form would be computed by subtracting the mean of 2 from each value and would be -1,0, 1.
|
|
|
BLIND
|
A type of experiment in which the subjects do not know which treatment they received.
|
|
|
BLOCKS
|
In an experiment, groups of similar units.
|
|
|
DISTRIBUTION
|
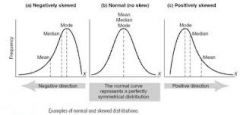
The distribution of empirical data is called a frequency distribution and consists of a count of the number of occurrences of each value. If the data are continuous, then a grouped frequency distribution is used. Typically, a distribution is portrayed using a frequency polygon or a histogram. Mathematical equations are often used to define distributions. The normal distribution is, perhaps, the best known example. Many empirical distributions are approximated well by mathematical distributions such as the normal distribution
|
|
|
CASE
|
The subject (or object) on which a measurement is made in statistical examination.
|
|
|
CATEGORICAL VARIABLE
|
A variable that can be grouped into categories, such as “yes” and “no.” Categories sometimes can be ordered as with “small,””medium,” and “large.”
|
|
|
CENSUS
|
An examinationof all individuals in the entire population.
|
|
|
CLINICAL TRIAL
|
A randomized experiment comparing medical treatments.
|
|
|
CLUSTER
|
On a plot, a group of data “clustering” close to the same value, away from other groups.
|
|
|
CLUSTER SAMPLING
|
When the units in the population are assigned to clusters (such as classrooms) and you take a simple random sample of the clusters.
|
|
|
COEFFICIENT OF DETERMINATION
|
the square of the correlation r. Tells the proportion of the total variation in y that can be explained by the relationship with x.
|
|
|
COMPARISON GROUP
|
In an experiment, a group that receives one of the treatments, often the standard treatment.
|
|
|
COMPLETELY RANDOMIZED DESIGN
|
An experimental design in which treatments are randomly assigned to subjects with restriction.
|
|
|
CONFOUNDING
|
The phenomenon that occurs when an experimental design has mixed together two possible influences on a response in such a way that it is impossible to separate their effects.
|
|
|
CONTINUOUS VARIABLE
|
A quantitative variable that can take on any value on an interval of real numbers.
|
|
|
CONTROL GROUP
|
In an experiment, a group that provides a standard for comparison to evaluate the effectiveness of a treatment; often given the placebo.
|
|
|
CONVENIENCE SAMPLE
|
A sample in which the units chosen from the population are the units that are easy to conclude.
|
|
|
CORRELATION
|
A numerical value between -1 and 1 inclusive that measures the strength and direction of a linear relationship between two variables.
|
|
|
DATA
|
A set of numbers or observations with a context and drawn from a real-life situation.
|
|
|
DOT PLOT
|
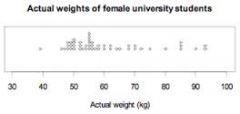
A graphical display that shows the values of a variable along a number line.
|
|
|
DOUBLE-BLIND
|
A type of experiment in which neither the subjects nor the research making eh measurements knows which treatment the subjects receive.
|
|
|
FREQUENCY (or COUNT)
|
The number of times a value occurs in the distribution.
|
|
|
FREQUENCY TABLE
|
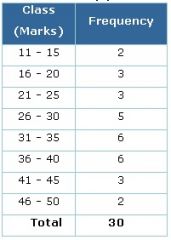
A table that gives the values and their frequencies (counts).
|
|
|
HISTOGRAM
|
A plot for quantitative variables that groups cases into rectangles or bars. The height of the bar shows the frequency.
|
|
|
INCORRECT RESPONSE BIAS
|
A bias resulting from responses that systematically wrong, such as from intentional lying, inaccurate measurement devices, or faulty memories.
|