![]()
![]()
![]()
Use LEFT and RIGHT arrow keys to navigate between flashcards;
Use UP and DOWN arrow keys to flip the card;
H to show hint;
A reads text to speech;
60 Cards in this Set
- Front
- Back
- 3rd side (hint)
|
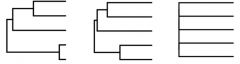
What is the difference between PCA and LDA? |
LDA finds the transformation of the variables that maximizes separation between 2 or more groups, unlike PCA which maximizes the variance in PC1. |
LDA finds unlike PCA which |
|
|
What is LDA? and what variables is it used for? |
LDA is Linear Discrimination Analysis. It is used when you have any number of continious predictor variables and one response categorical variable. |
Discrimination, Continious? Categorical? |
|
|
What does NMDS stand for and what is it used for? |
Non-metric Multidimensional Scaling. It is used in multidimensional data sets, the data is 'flattened' to visualize it in 2D, while making as few assumptions as possible. |
|
|
|
What are the steps in NMDS? |
first, convert the community data into dissimilarities between sites. Then find the set of coordinates in 2D space that best represent dissimilarity between sites. |
for community data. 2 steps included. |
|
|
What are the 3 dissimilarity indicies to choose from? |
1) Euclidean 2) Bray-Curtis dissimilarity 3) Jaccard |
Just the names E BC J |
|
|
the dissimilarity indicy; Euclidean, is used when: |
When you have "geometric distances" in the data, dominated by abundant species |
|
|
|
The dissimilarity indicy; Bray-Curtis, is used when: |
as a default, normally fine to use |
|
|
|
The dissimilarity indicy; Jaccard, is used when: |
When you have presence/absence data. |
|
|
|
What is stress in dissimilarity indicies? |
Stress is a measure of how poorly the distances in the re-scaled space match the dissimilarities in the original data. |
|
|
|
What is the rule of thumb for Stress measurements? |
<0.1 = excellent quality of representation of data. <0.3 = Worthless quality of representation of data. |
|
|
|
Is PCA a form of unconstrained or constrained Ordination? |
Unconstrained because the outcome depends only on the multi-variate data set. |
|
|
|
What is RDA? when is it used? |
RDA= Redundancy Analysis. It is used when the community data matrix is the response variable, with any combination of predictor variables (categorical or continious) |
|
|
|
Is RDA a form of constrained or unconstrained Ordination? |
Constrained Ordination - because the outcome depends on the predictor variables. |
|
|
|
What happen Residuals and Equal variances are not normally distributed? |
We can either transform the data (try) or use GLM. |
|
|
|
After the other various assumptions, what can we do if our Data points are not independent? |
we use Auto-correlation. there are 2 types Spatial auto-correlation and Phylogenetic auto-correlation |
2 types of A___-C_________. |
|
|
How do manipulative and mensurative experiments differ in non-independent data? |
Manipulative experiment: with good experimental design, this should not be a problem. to account for spatial temporal or environmental variation we can use block factors, randomised design and ANCOVA. Mensurative experiment: Cant control as many factors. May have limiting sampling units. Potential for auto-correlation between samples. |
|
|
|
What is Auto-correlation? |
Auto-correlation is used when we have non-independent data points. the data tend to be more similar to each other, independent of our predictor variables. |
|
|
|
What is Spatial Auto-Correlation? |
When the samples are similar between spatially close samples, they cause environmental and dispersal variation between sites. |
|
|
|
How can we test for Spatial Auto-Correlation? - what are the 2 test names? |
We can use 2 tests, Mantel Test and Moran's I test. |
just the names of the 2 tests |
|
|
How does the test for spatial auto-correlation; Mantel Test differ to Moran's I test? |
Mantel test is low in statistical power, it compares 2 distance matrices. - we only use Mantel test when we the data is distances. Moran's I test statistic ranges from -1-1 and measures if points are more or less spatially different than what they should be. |
|
|
|
What is the test statistic for the Spatial Auto-correlation; Moran's I test? |
the test statistic ranges from -1 to 1. if the value =-1 there is negative spatial auto-correlation, which means the data is too overdispersed. If it is 1, there is a positive spatial auto-correlation, and the data is too underdispersed. |
|
|
|
How can we visualize spatial Auto-correlation? |
Variogram visualizes spatial autocorrelation. It shows group samples based on spatial difference between them, then they plot the variance among samples as function of distance. |
Increasing curve = positive spatial auto-correlation Decreasing curve = negative spatial auto-correlation. |
|
|
How can we account for Spatial Auto-correlation? |
Use Generalized least squares (a step up from general least squares). this gives greater weight to more independent points, and less weight to points that are closer together. |

|
|
|
What is Phylogenetic Auto-correlation? |
this is similarity between closely related species, causing shared inherited characteristics. |
|
|
|
What is the problem with Phylogenetic Auto-correlation? |
We may have fewer independent data points than we think. A regression doesnt account for relatedness. We may identify a relationship that is not real (its adaptive) or fail to identify a real relationship.
|
real/not real? |
|
|
How do we test for Phylogenetic Auto-correlation? |
Pagels Lambda, it asks if the evolutionary distance between species predicts the extent of their trait divergence. |
|
|
|
What is the test statistic for Pagels Lambda (phylogenetic Auto-correlation test)? |
When Lambda = 1, phylogenetic signal is string ans branch lengths of the tree predict the amount of trait divergence. as lambda approaches 0, the internal branches are less influential, so the phylogenetic signal is weaker |
|
|
|
How can you visualize the Pagels Lambda phylogenetic auto-correlation? |
We can visualize by plotting the trait divergence vs. phylogenetic distance. |
|
|
|
How can we account for the phylogenetic auto-correaltion? |
The generalized least squares(a step up from general least squares) this gives greater weight to more independent points, and less weight to points that are closer together. |
|
|
|
What are the 4 types of data distributions? |
Normal Lognormal Poisson Binomial |
|
|
|
What is the definition for Generalized Linear Models |
GLMs refer to the response variables. They have 2 concepts a family and link function. The family can be (gaussian, poisson, binomial, quassipoisson, quassibinomial). The link function connects the x and y together, using g as the link so that g(y) is a function of x. |
g(y) function of x |
|
|
What does the GLM: Logistic Regression entail? |
Logistic Regression has binomial responses. the Family = binomial and Link function = logit. The binomial response varies in (n). we need to provide the number of successes and failures per population sampled. if we only have the proportions ,we can use quassibinomial (but not ideal) |
|
|
|
What does the GLM: Poisson Regression entail? |
Poisson regression has poisson responses. The family = Poisson, Link = log. if truely poisson then lambda = mean=variance. Observations may be clustered, or spread out. Solution = quassipoisson. |
spread out = overdispersed clustered = underdispersed |
|
|
What does the GLM: Lognormal Regression entail? |
Lognormal regression has lognormally distributed response variables. The Family = Gaussian, the link = log. |
|
|
|
What is Model Selection? |
Model selection is deciding which predictor variables are important enough to keep in a model. |
|
|
|
For model selection, what are the 2 things we actually want out model to do in the end? |
1) Explain the data well (high R2) 2) Predict new data (cross validation) |
|
|
|
What is Likelihood? |
the probability of our data, given the model. Basically how likely are we to get the data we got, condiditonal to the model being correct? |
|
|
|
What is the Maximum likelihood? |
just like the sample mean, how to estimate the parameter values. The max likelihood is where the parameter is at highest probability to occur. |
|
|
|
What is the OLD and NEW way of model selection? |
OLD = Stepwise regression. We fix the terms, delete non-significant terms, refit and keep deleting until only significant terms are left. NEW= Measure Performance considering fit and complexity |
|
|
|
What is wrong with the OLD way of model selection? |
The OLD way of model selection creates p-values and bias in estimating both significance and parameter values. |
|
|
|
How do we measure the performance of a model (in NEW way of Model Selection)? |
We need to consider the (1) fit [how well does it explain the data] and (2) complexity [how many parameters are needed] We use AIC to measure the performance. |
(1) and (2). |
|
|
What is AIC and how does it work? |
AIC = Akaike Information Criterion. This measurees the information lost when we fit each candidate model to the data. it tells us which model has the best balance of fit and complexity. |
|
|
|
What is the AIC Formula? and what do the parameters mean? |
AIC = -2Log L + 2K -2Log L = Fit value 2K = Complexity the lower the AIC the more parsimonious and better model performance. |
|
|
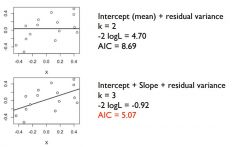
Which model would you select? |
the second because the AIC is less.
|
|
|
|
How much AIC difference is needed in estimating which model is better? |
<2 = weak evidence against the worst model >7= Strong evidence against the worst model |
|
|
|
What do you do when you have the AIC values? |
AIC can be converted into relative likelihoods of each model and Akaike weights, which add up to 1.0 to show proportional support for each model. |
|
|
|
What is Model Averaging? When is it used? |
Model averaging is when we use Akaike weights to rank a large number of models to measure the importance of each parameter. It is used in Model selection to help decide which predictor variables to include in the model based on their importance in Model averaging |
|
|
|
How do you interpret Model Averaging tables? |
we see which variables are important in out model (depending on the proportion of models that include the variable and how close they are to 1.0). |
|
|
|
What are Akaike Weights used for? |
Akaike weights are used in model averaging. They give weight which ranks a large number of models, and the importance of eahc parameter. |
Note. Use of model averaging is still controversial. |
|
|
What is a MANOVA? and what type od results does it give? |
MANOVA has 1 or more categorical predictor variables, and 2 or more continious predictor variables. it gives 2 types of results: 1) multivariate effects and 2) univariate effects (results for each response variable). |
|
|
|
What are the assumptions of MANOVA? |
- Homogenetiy of variances - Independence - Normality - Homogeneity of covariance matricies. |
|
|
|
What is the problem with MANOVA? |
you cant fit a MANOVA if you have many response variables relative to the number of observations (d.f.) also, what happens if we just want to summarize the variation in a multivatative data set? OR id we want to look at correlations between 2 multivaiate data sets? and dont have predictors and response variables. |
|
|
|
What is Dimensionality? how can we reduce it? |
this is when many response variables are likely to be correlated with eachother. to reduce we use ordination |
it makes us question how much variation is meaningful |
|
|
What is Ordination? Why is it important? |
Ordination is adapting multidimensional data points so it can be interpreted in a 2D way. it converts multidimensional data sets into continious axes that summarizes the important variation |
There are many ordination methods, we will look at PCA, LDA, NMDS & RDA |
|
|
What is PCA? and what is it used for? |
PCA is Principal components Analysis. It rotates the data orthogonally sorting the data to find the highest and lowest variance explained. It is used as a method of Ordination to reduce Dimensionality |
|
|
|
What are the steps of PCA? |
1) identify the major axis that accounts for the most variation in the data 2) identify the axis that acocunts for most of the remaining variation, but is orthogonal to the first axis. 3) PCA works by rotating the axis so the variables are sorted from highest to lowest variace explained. the distances between each observation stays the same. |
|
|
|
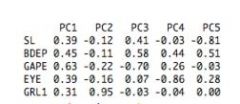
How do you interpret PCA? |
interpretation is done by the eigenvectors (coefficents) which tellyou which variables contribute to which PC axis. |
|
|
|
What can create noise in the PCA data? What do we do about the noise? |
Noise can be created by lesser PC axes which have very low variance. The noise we need to take out, to only account for the axes that are important in the variation. |
|
|
|
How do we know how many axes to keep in PCA? |
1) as many as have a sensible biological interpretation 2) enough to explain ~95% of the total variation in the data set. 3) Those that explain for more vairance than expected under a "broken stick" null model |
1) 2) 3) |
|
|
What variables would make us want to use a PCA? |
when we want to use morphology as a predictor or response variable but we dont want to use every trait in the analysis. we want to avoid collinear predictors. |
|