![]()
![]()
![]()
Use LEFT and RIGHT arrow keys to navigate between flashcards;
Use UP and DOWN arrow keys to flip the card;
H to show hint;
A reads text to speech;
31 Cards in this Set
- Front
- Back
|
Why do people move to cities in LEDC's? Pull factors |
In hope of better job opportunities. Better health care. Anything is better than shanty towns and slums. Better living conditions. Education opportunities. Better transport. Leisure. Family? |
|
|
Why do people move to cities in LEDC'S? Push factors |
Drought and flooding. Rural poverty. Low pay. Lack of opportunities. Lack of services. Lack of investment. War. |
|
|
Fastest growing cities |
In Asia and Africa with an urban annual increase of 3% compared with the global average of 2.1%. 324 cities with populations over 750,000 grew by 20%, 84 in China. But in Abuja (Nigeria) grew by 139.7% |
|
|
Core |
Cores are typically the centre and have high tech, high pay, and high capital investment.
These areas create the multiplier effect. Core and periphery are important to geography because of spatial form- can be recognised on maps- London is core. Scale- patterns occur at all scales Process- not static qne change over time. |
|
|
Periphery |
Typically the outskirts. Consists of low tech, low pay, and low capital investment. Both core and periphery can take place in one industry. |
|
|
Multiplier effect |
|
|
|
Mumbai- Dharavi, core and periphery slums. |
Westert coast of Indias richest state maharashtra. 20 million people and 1000 new migrants a day. By 2050 could be the largest city and it's wealth is 33% of Indias entire tax revenue. Rent in exclusive parts is higher than new york and London. Has headquarters like tata steel. Over 3500 die on its suburban railways each year. 1 million illegally live in Dharavi ( 1 of the world's largest shanty towns) and 60% of its population live in communities like this. Average incomes are about £40 a month and rent at £12 a month. 80% of the waste is recycled and is sold-employs 1000. Forced to work in informal sector+ some is even illegal. Vision Mumbai 2004 aim to finish by 2013. |
|
|
Vision Mumbai |
Increase and improve housing for all. Increase finance and reduce administration expenditure. Upgrade transport infrastructure and all infrastructure. Boost economic growth by 8/10% a year. Improve and speed up governance. |
|
|
Millionaire city |
City with over 1 million inhabitants often in MEDC's and now in LEDC's such as London and Mumbai. |
|
|
World or global cities |
Centres for financial services. Attract specialised business services. Clustering attracts business tourism. Resource bases- knowledge Learning centres-unis and education Centres of spatial proximity-tacit knowledge in CBD's. More likely to happen in densely populated areas and high activities. High levels of synergy. Shed a lot of low value activities. Wide range of jobs- spatial differentiation. |
|
|
Sub world Cities |
Population of 1-5 million and they have specialised futons such as banking and fashion and media |
|
|
Mega cities |
At least 10 million population Population density is usually over 2000/km squared. Often in MEDC's (N Y was the first in 50s) but has now spread to LEDC's due to high rates of natural increase and high rates of rural urban migration |
|
|
Manchester- decline |
Weavers settled and began to spin and weave wool and linen. Industrial revolution so improved and new technology. Mass produce in factories and cotton imported from Liverpool. Cloth mills built and more jobs meant immigration from places like Ireland. In 1853 over 300,000 and became a city. Poor housing was built but was cheap for workers. Terraces and tenements became slums and half of babies died before 5 due to pollution etc. Population fell due to cheaper cloth being sold by other countries so couldn't compete and had to close. So declined. |
|
|
Los Angeles suburbanisation. developed because of |
It developed because of- TRANSPORT-(transcontinental railway 1876) LAX airport (2010. 6th busiest in the world. EMPLOYMENT- discovery of oil, Ford car plant, civil and military test flights aswell as production sites. IMAGE- film industry in Hollywood. 1960s affluence Brough tourists to film theme parks -further employment at Disney and universal studios. GREATER AFFLUENCE- choice about where to live, fastest growth was in 60/70s on the sunbelt of california. 70s it was USAs fastest growing city. 2000 had 14 million people living there and fastest growing places in LA was Riverside and San Bernardinos with 6% per annum. |
|
|
Los Angeles suburbanisation results |
Suburbanistaion- California is 60% bigger than the UK. offered better everything, better tramways in 20/30s which meant they could live further away from work and then motorways. 80s spread out as far as San Bernardinos which is 2 hours away. As suburbs grew the centre declined and became a poor and derelict area.
Urban smog- 10 million car owners and congested freeways. Traps pollution can cause asthma. Poor public transport so car use is high. 2005, 10.2% public transport (1.7m journeys a day) compared to 40% In london (12m journeys a day).
Donut and edge cities- car, tyre steel and aircraft factories closed due to overseas competition. All business moved outwards as it offered more and cheaper space and lower taxes. Social segregation- left poor in LA as rich crowds move out so deprived were left behind. Rich were there in clusters but with security. |
|
|
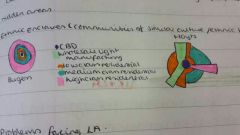
CBD models |
|
|
|
Problems facing LA |
Water- demand for irrigation increases in gardens and pools. 50% evaporates before it even reaches LA Waste- 24m in LA produce 50,000 tonnes a day but have a 25 cents refund for any liquid container given back to shops. Energy- 2010 caused blackouts when power stations were unable to cope with demand in august and September due to heat waves. |
|
|
Why has suburbanisation occurred? |
Growth of public transport, increased private car ownership, image-Hollywood. 1930s ribbon development alongside main roads. 1940s green belt. council housing on the suburbs. More green space, more retail/factories, less crime, greater affluence, better services and facilities, education, transport, declining jobs, congestion and pollution |
|
|
Counter urbanisation |
Migration from urban to rural or less urban. People want to escape crime, pollution, dirt. Land and house prices are cheaper, demand for second home. Greater affluence, better transport links and more car ownership. 1981-1996 rural areas gained more than 1 million jobs. Improved technology. Gentrified areas causes tension between locals and new comers. Local services close down and are amalgamated into larger units. |
|
|
Evidence for counter urbanisation |
Increase use of railways and car parks. Increased house value. Construction of better housing, and conversion or farmland to residency. Emmigration or young adults in search for jobs and decline of elderly due to death. Immigration of family's and affluent people |
|
|
Counter urbanisation case study |
St Ives- used to farmland but now housing New exclusive apartment blocks in centre. Affecting population structure of the town. Young move to centre due to transport links for working in London and elderly mobe to rural to escape city life. People have higher incomes and living standards than anywhere else in UK . Commuting to london increase in 90s but now 25% do. Railway got better and quicker Annual rail tickets cost under £4,000 but still cost less than living in London. Services changed to meet demands. Still got some low order services like greengrocers and bakers. But have a lot of high order like restaurants and designer clothes shops to meet needs of the wealthy. |
|
|
Urban decline |
Due to pollution, lack of capital/social investment, vandalism, deterioration, poor infrastructure,high crime rates, poor quality housing, Emmigration, declining industry due to places moving out to more but cheaper land,high unemployment rates, loss of jobs, lack of community. |
|
|
Solutions for urban decline |
Toursim-Olympics, increase employment, shopping centres, themeparks, festivals and events Infrastructure, pedestrianisation. Transport links, efficient, cheap, car parks, park and ride. Cheap land, inward investment. Gentrification |
|
|
London docklands decline- reverse multiplier effect. |
Deindrustrialisation- goods produced were more expensive than overseas. Lots of task forces closed in 1980s, masses of unemployment Until 1960s 33% of the labour force worked in manufacturing but in 2010 it accounted for 6% of employment. Margaret Thatcher encouraged a post industrial economy directing investment towards the knowledge economy- high value expertise, banking etc. Tourism and property creating a new image based on industrial heritage.
Counter urbanisation- built towns on outskirts of London, slum clearance after war and built to help people 30-50km away, greenbelt in 1947, dormitory area.
Docks closed in 1981- Moved to Tilbury as they increased the size of ships which couldn't fit in London. Container ships and computerisation replaced people. Resulted in 12000 jobs lost from 78-81. 60% of men were unemployed in 81. Derelict and unattractive to investors as to expensive. East London pop decreased 18.5% from 71-81 |
|
|
MARKET LED REGENERATION OF LONDON DOCKLANDS |
Rebranding cities image-garden festivals to create a greener image. Extension of jubilee line which covers most of the docklands area. New Road links and London City airport which he easy access to other European capitals. Gave incentives like tax breaks, longer working hours and deregulation to encourage businesses to set up there. Regenerate 10,000 old homes and create 22,000 new ones and create 63,000 new jobs. UEL. Canary wharf business and media centre. 200,000 trees planted |
|
|
London 2012 Olympics Benefits |
Social- events and festivals, national paralypmic day. Planning permission for 7000 homes 2012, copper box arena cafe and playground opens, North park opens 2013, aquatics centre, Lee velopark+ 3 tracks, south park & arcelor orbit, hockey and tennis, canal park 2014, Loughborough uni campus London 2015. Created 3000 new jobs. Olympic village which shoul provide 2800 units but 35% affordable.
Economic- 700,000 revisit for all of the social aspects mentioned, which brings in lots of revenue, reopen all services means tourists and money. Reopen stadium for events 2015 as as well as uni in Loughborough uni providing skills for higher skilled jobs.
Environemental- re landscaping the area by planting trees and clearing out all the toxic waste in the river Lea. Also provide benches and footpaths. |
|
|
London 2012 Olympics negatives |
Transport- expected extra 3 million a day in the tube and train lines. Bad and cramped conditions. Cost- expected 2.4bn but in 2007 budget increased to 9.3bn with the actual cost under budget at 9.2bn. Stadiums- after the games there was no purpose for them, but the cost of upkeep is very expensive. Sports- did not boost mass participation, sporting in youth fell 2011, in 2011 we had the 2nd highest obesity rate in Europe. Lack of real regeneration- used to be community but now it corporate such as sale of Olympic village and Westfield. Rebuild not regeneration. Also could have spent that amount of money on many other places Instead of one which is already thriving. |
|
|
RETAIL LED REGENERATION Westfield centre, Stratford. |
8500 jobs for many locals in the retail industry due to the 300 new stores being built, they also opened a retail academy to raise qualifications in the area. Orginally run down by competing out of town shopping centres. It created more train and tube links along the Jubilee line. Limited car parking. No fast food chains, all more healthy and slightly more expensive which helps reduce obesity rates. 80% of shop are high end like prada, so not really for locals, more for londoners which is why there are several tube links and it's more expensive because of the higher paid jobs and more disposable income. |
|
|
Sustainability |
Meeting the needs of the present generation without compromising future generations ability to meet there needs |
|
|
How to make an area sustainable |
Limit industry pollution, recycle, reuse rainwater, rooftop gardens, plant trees and green spaces, solar power and wind farms, reduce fuel powered cars, pedestrianisation, encourage biking, reduce fossil fuel use, waste management, increase green public transport, eco friendly buildings, |
|
|
Sustainable- Vancouver, Canada |
Bike paths. 250 miles of bike trails Lowest capita of greenhouse gas emissions. Over 80% is supplied by hydroelectricity(they are on the coast). Ecodensity, build up not out and be energy efficient. Aim to be carbon neutral. Pedestrianised city, widen paths and encourage alternative transportation. Sea Bus, Sky Train and Streetcar all have latest clean technology. Require all new family residences to have electric car plug ins. Plant 150,000 trees in the city. Enhance 25ha of natural area. Open green spaces ensure everyone lives within a 5 minute walk of one. House prices cost £400,000-£500,000 per 500sqf. 1 bed 1 bath |