![]()
![]()
![]()
Use LEFT and RIGHT arrow keys to navigate between flashcards;
Use UP and DOWN arrow keys to flip the card;
H to show hint;
A reads text to speech;
39 Cards in this Set
- Front
- Back
- 3rd side (hint)
|
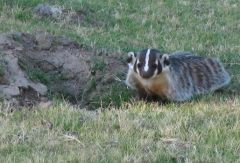
American Badger |
AB |
|
|
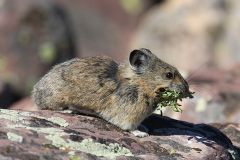
American Pika |
AP |
|
|
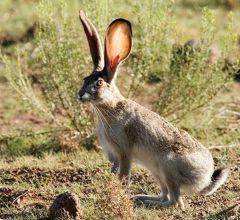
Black-tailed jackrabbit |
BT J |
|
|
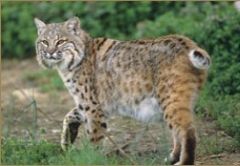
Bobcat |
B |
|
|
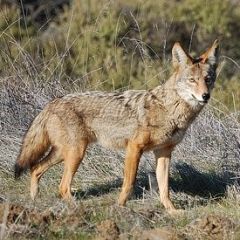
Coyote |
C |
|
|
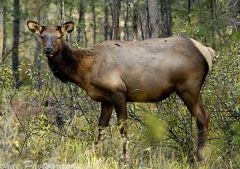
Elk |
E |
|
|
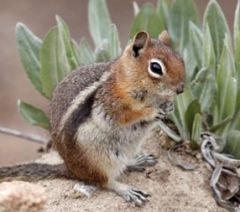
Golden-Mantled Ground Squirrell |
GM G S |
|
|
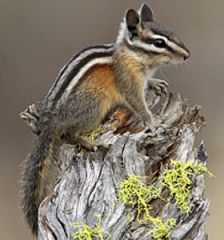
Least Chipmunk |
L C |
|
|
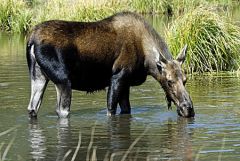
Moose |
M |
|

|
Mountain Cottontail |
M C |
|
|
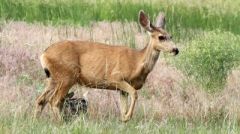
Mule Deer |
M D |
|

|
Red Fox |
R F |
|

|
Red Squirrel |
R S |
|
|
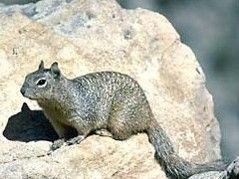
Rock Squirrel |
R S |
|

|
Short-tailed weasel |
ST W |
|
|
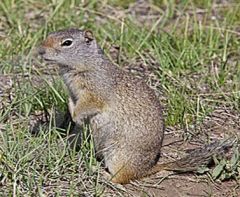
Uintah Ground Squirrel |
U G S |
|
|
Yellow-bellied marmot |
Y B M |
|
|
Why do managers need to measure abundance vs. density? For what conservation purpose? |
Abundance – how many total individuals – Key for determining protection needs for a species, determining effects of events or human impact on a species, harvesting rates & hunting permits Density – How many individuals per unit area (abundance per unit area) – Key for managing populations. Understanding trends in density is very important for considering habitat impacts by wildlife and impacts of habitat loss on wildlife. to better understand an ecology and how it functions |
|
|
|
• total counts |
counting total numbers of individuals in a population – seldom practical, but easily interpreted - almost impossible - usually inacurate - expensive |
|
|
|
indices |
??? |
|
|
|
estimates |
using sampling to infer population numbers, often the only practicable way to determine abundance |
|
|
|
Transects vs. quadrats |
Transects - following a pattern off of one main line and branching out to find population members Quadrats - working in defined separate sections |
|
|
|
random vs. systematic |
Random - working randomly in sections and finding population memebers Systematic - starting form a determined central point you work outwords |
|
|
|
Match life history of species to technique |
Designing your study 1. Divide the area of interest into sampling units 2. Decide to select sampling units randomly or systematically 3. Decide whether to sample using Transects or Quadrats 4. Decide whether to sample with or without replacement – do you allow same unit to be sampled more than once or not? • Replacement means that with random sampling, if your dart hits the same location on the map, you’ll sample that same location twice. • The effect of this technique depends on the mobility of the species (do they leave the area or not?) • It tends to allow for double counting of a single individual |
|
|
|
Understand sources & relationships of bias & sampling error, accuracy and precision |
Bias error: derived from systematic distortion of counting technique or diminished counting ability by observer (bad counting) – Usually produces an undercount, inaccuracy Sampling error: lack of standardization of sampling technique, inadequate sampling size, inefficient sampling (bad study design) Accuracy = how closely sampling approaches the “real” number PRECISION = how much scatter in data sets, (a measure of sampling error & how well sampling methods are standardized) |
|
|
|
Understand how to estimate population abundance using Mark-Recapture (know the formula!) |
T1 = (N1xT2)/N2 • T1 = total population number • T2 = total number captured second time • N1 = total number captured first time and marked • N2 = number of marked individuals that were recaptured |
|
|
|
Know how to fill out a life table, and what the equations & functions of a life table are. |
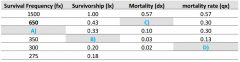
Survivorship = lx=fx/fx starting (a function of how many in that age group survive) Mortality = dx=lx-l(x+1) (a function of survivorship from one year to the next)Mortality Rate = qx=dx/lx (a function of mortality in relation to survivorship) |
|
|
|
What are the direct vs. indirect methods for obtaining life table data? Under which circumstances would a biologist use each method?
|
1. Monitor fates of every individual in a population (not practical, seldom used) – Examples when this method is practical: rare, large animals with small populations 2. Mark-Recapture: generally more practical and used more often (and similar to estimating abundance) – Capture & Mark large proportion of individuals in a population (can be ear-tagging, leg banding, ID’ing individual physical traits) – Return later and “recapture” a portion of those individuals to estimate the probability of survival after a given period of time |
|
|
|
Understand the difference between the maximum intrinsic rate of increase and the observed rate of increase |
Read slide show 7 |
|
|
|
Define these terms: fecundity, mortality, age distributions, logistic growth, exponential growth |
Read slide show 7 |
|
|
|
– Interspecific Competition |
Individuals of different species lower one another’s survival and fitness while seeking a common, usually limited, resource |
|
|
|
Predation |
Typical Predation - One species actively hunting, killing, and eating another species – Herbivory is considered by biologists a special category of predaEon • Ex. Seed predation, fruit predation: common terms in botany – Cannibalism (intraspecific predation) – also considered a special category of predation – Parasitism - A kind of predation where one species feeds on an individual of another species, but generally does not kill that individual quickly • The parasitic individual is generally, but not always, confined to a single individual host |
|
|
|
facilitation |
Where one species is benefited by another species, and that other species is unaffected by the interaction. Often a larger host species improving or providing food, shelter, habitat, locomotion or support to a smaller commensal species |
|
|
|
mutualism |
Where both species’ survival and fitness is improved by the interspecific interaction. Symbiosis occurs where there is a close and prolonged relationship between the multiple species. |
|
|
|
niche-fundamental vs realized |
The FUNDAMENTAL NICHE consists of the full ranges of all limiting factors: • upper elevations or temps • soil types, precip. • presence of appropriate and abundant forage/prey species, etcthat make up the physiologically possible occupied habitat of a species without taking exclusion by competitors or predators into account – REALIZED NICHE: what we actually observe: • the presence of competing or predatory species reduces the fundamental niche to a narrower range of conditions than a species would otherwise utilize |
|
|
|
competitive exclusion |
the presence of one species excludes another from using the same habitat/resource. – two species that compete for the exact same resources cannot stably coexist – As a consequence, competing species evolve distinct habitat use patterns in areas where they both coexist |
|
|
|
competitive release |
The expansion of the range of a species when a competitor for its niche is removed. |
|
|
|
resources partitioning |
When resources are limiting, species should contract their niche as a result of competition: partitioning of resources & habitat selection |
|
|
|
Know their implications for conservation • Understand the scientific methods for determining their presence in natural systems • Understand the evolutionary effects of predation on both prey and predator species |
read slide show 9 |
|